## Density Plot: Comparison of Two Distributions
### Overview
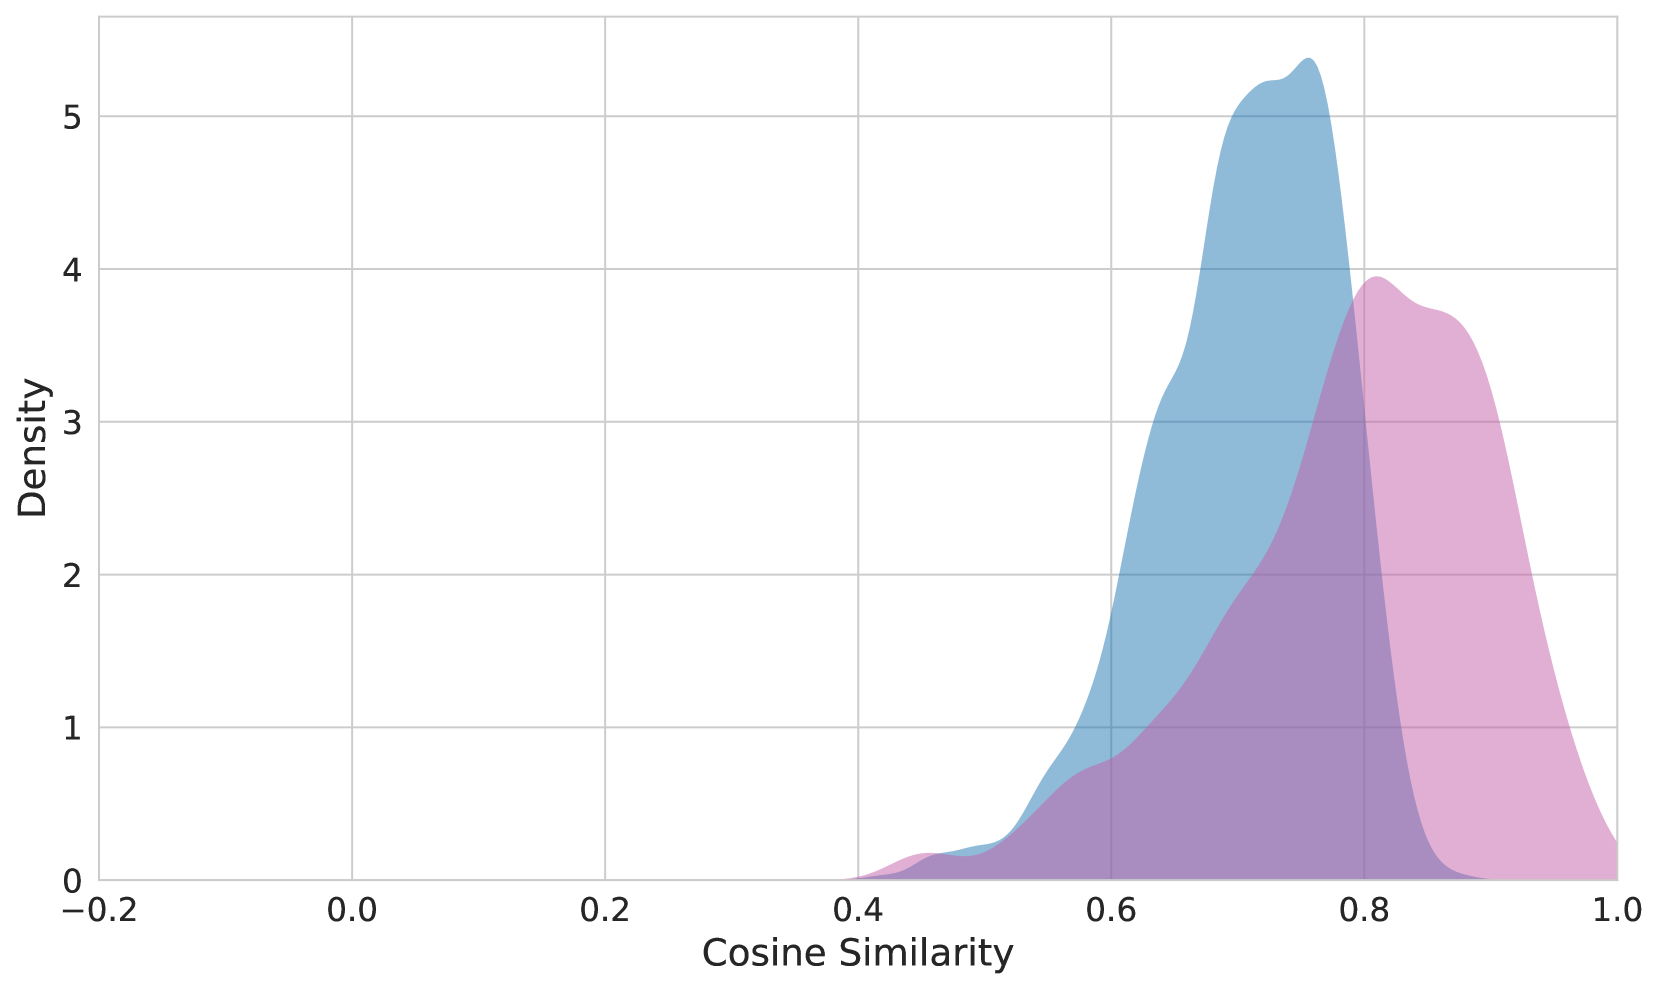
The image displays a density plot comparing two overlapping distributions. The x-axis represents **Cosine Similarity** (ranging from -0.2 to 1.0), and the y-axis represents **Density** (ranging from 0 to 5). Two curves are present: a **blue distribution** peaking near 0.7 and a **pink distribution** peaking near 0.85. The curves overlap significantly between 0.6 and 0.9, with the blue distribution extending slightly further to the right (up to 1.0) and the pink distribution tapering off at ~0.9.
### Components/Axes
- **X-axis (Cosine Similarity)**: Labeled with values from -0.2 to 1.0 in increments of 0.2.
- **Y-axis (Density)**: Labeled with values from 0 to 5 in increments of 1.
- **Legend**: Two colors are used: **blue** and **pink**, though no explicit labels are provided for the distributions.
### Detailed Analysis
1. **Blue Distribution**:
- Peaks at approximately **0.7** with a density of ~5.
- Spreads from ~0.5 to 1.0, with a gradual decline after the peak.
- Overlaps with the pink distribution between ~0.6 and 0.9.
2. **Pink Distribution**:
- Peaks at approximately **0.85** with a density of ~4.
- Spreads from ~0.6 to 0.9, with a sharper decline after the peak.
- Overlaps with the blue distribution between ~0.6 and 0.9.
3. **Overlap Region**:
- Between **0.6 and 0.9**, both distributions intersect, with the blue curve dominating in the lower half (0.6–0.75) and the pink curve dominating in the upper half (0.75–0.9).
### Key Observations
- The blue distribution has a **higher peak density** (~5 vs. ~4) but a **wider spread** (0.5–1.0 vs. 0.6–0.9).
- The pink distribution is **more concentrated** around its peak (0.85) but has a **narrower range**.
- The overlap suggests **partial similarity** between the two groups, but distinct clustering at their respective peaks.
### Interpretation
The data suggests two distinct groups with differing cosine similarity distributions. The blue group exhibits greater variability (wider spread) and a higher density at its peak, while the pink group is more tightly clustered around a higher similarity value (0.85). The overlap indicates some shared characteristics, but the distinct peaks imply **separate subpopulations** or **different levels of similarity** within the dataset. The absence of explicit labels for the distributions limits direct interpretation of their real-world significance, but the visual trends highlight differences in central tendency and dispersion.