## Diagram: Correspondence Filtering and Encoding/Decoding
### Overview
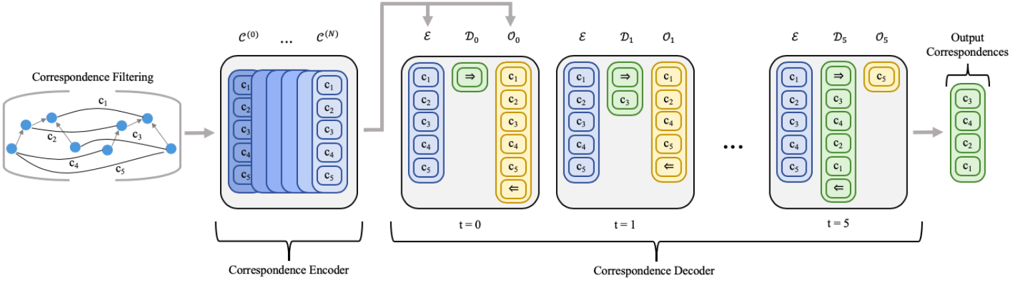
The image is a diagram illustrating a process of correspondence filtering, encoding, and decoding. It shows how initial correspondences are filtered, encoded into a latent representation, and then decoded over several time steps to produce output correspondences.
### Components/Axes
* **Correspondence Filtering:** A network of nodes labeled c1, c2, c3, c4, and c5, connected by lines with arrows indicating direction.
* **Correspondence Encoder:** Takes the filtered correspondences and encodes them into a series of representations, denoted as C^(0) to C^(N). Each representation contains c1, c2, c3, c4, and c5.
* **Correspondence Decoder:** Decodes the encoded representation over time (t=0, t=1, ..., t=5) to produce output correspondences.
* **Epsilon (E):** Represents the encoded state at each time step. Contains c1, c2, c3, c4, and c5.
* **D_t:** Represents the decoder's state at time t. Contains c1, c2, c3, c4, and c5.
* **O_t:** Represents the output at time t. Contains c1, c2, c3, c4, and c5.
* **Output Correspondences:** The final output of the decoder, containing c1, c2, c3, c4, and c5.
### Detailed Analysis
The diagram can be broken down into three main stages:
1. **Correspondence Filtering:**
* The initial stage involves filtering correspondences. A network of nodes (c1 to c5) is shown, with connections between them.
2. **Correspondence Encoder:**
* The filtered correspondences are then encoded. The encoder takes the initial filtered correspondences and transforms them into a series of encoded representations, denoted as C^(0) to C^(N). Each representation contains the elements c1, c2, c3, c4, and c5.
3. **Correspondence Decoder:**
* The encoded representation is then decoded over several time steps (t=0, t=1, ..., t=5).
* At each time step, the decoder takes the encoded state (Epsilon), the decoder's state (D\_t), and produces an output (O\_t).
* The decoder's state (D\_t) contains elements c1, c2, c3, c4, and c5, which are represented by green rounded rectangles.
* The output (O\_t) contains elements c1, c2, c3, c4, and c5, which are represented by yellow rounded rectangles.
* Arrows between the decoder's state and the output indicate the transformation or mapping of correspondences.
* At t=0, the arrow points from D0 to c1 in O0.
* At t=1, the arrow points from D1 to c3 in O1, and an arrow points from c5 in D1 to D1.
* At t=5, the arrow points from D5 to c5 in O5, and an arrow points from c1 in D5 to D5.
* The final output of the decoder is the "Output Correspondences," which contains the elements c1, c2, c3, c4, and c5, represented by green rounded rectangles.
### Key Observations
* The diagram illustrates a sequential process of filtering, encoding, and decoding correspondences.
* The decoder operates over multiple time steps, refining the output at each step.
* The arrows between the decoder's state and the output indicate the transformation or mapping of correspondences.
### Interpretation
The diagram represents a system for processing correspondences, likely in a machine learning context. The correspondence filtering stage could represent an initial selection or weighting of potential matches. The encoder compresses this information into a latent representation, and the decoder then reconstructs the correspondences over time, potentially refining them or resolving ambiguities. The arrows within the decoder suggest a dynamic process where the decoder's state influences the output at each time step. The final "Output Correspondences" represent the system's best estimate of the true correspondences.