\n
## Diagram: Correspondence Encoder-Decoder Network
### Overview
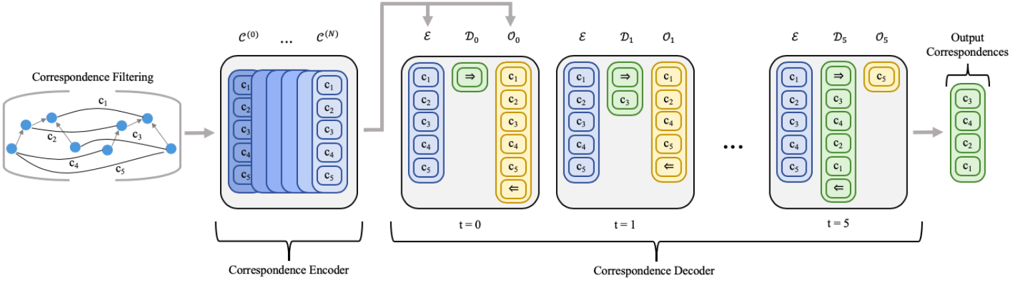
This diagram illustrates the architecture of a correspondence encoder-decoder network. The network takes an initial correspondence filtering stage and processes it through an encoder, followed by a decoder with multiple time steps to produce output correspondences. The diagram focuses on the flow of information and the representation of correspondences at each stage.
### Components/Axes
The diagram is segmented into three main sections: Correspondence Filtering, Correspondence Encoder, and Correspondence Decoder.
* **Correspondence Filtering:** Depicts a graph with nodes labeled c1 through c5, connected by blue lines representing relationships or correspondences.
* **Correspondence Encoder:** Consists of a series of stacked blue rectangular blocks labeled C(0) through C(N), representing encoded features.
* **Correspondence Decoder:** A series of blocks labeled with time steps t=0 to t=5. Each block contains two components: a yellow rectangle labeled 'ε' and a green rectangle labeled 'D'. Within each 'D' block are circular nodes labeled o1 through o5, with arrows indicating flow. The output correspondences are shown on the far right, also as circular nodes labeled c1 through c5, enclosed in a curved bracket.
* **Labels:** The diagram includes labels for each component: "Correspondence Filtering", "Correspondence Encoder", "Correspondence Decoder", "Output Correspondences". Time steps are labeled as 't=0', 't=1', 't=5', and '...'.
* **Arrows:** White arrows indicate the direction of information flow.
### Detailed Analysis or Content Details
The diagram shows a sequential process:
1. **Correspondence Filtering:** The initial stage represents a graph with 5 nodes (c1, c2, c3, c4, c5) and connections between them. The exact nature of these connections isn't specified, but they represent initial correspondences.
2. **Correspondence Encoder:** The encoder takes the filtered correspondences and transforms them into a series of encoded features, represented by the stacked blue blocks C(0) to C(N). The number of encoder layers (N) is not explicitly defined. Each block contains 5 circular nodes labeled c1 through c5.
3. **Correspondence Decoder:** The decoder takes the encoded features and iteratively refines the correspondences over time steps t=0 to t=5 (and potentially more, indicated by "...").
* **t=0:** The decoder block contains 'ε' (likely representing some transformation or input) and 'D0' with nodes o1 through o5. Arrows indicate flow between nodes.
* **t=1:** Similar to t=0, with 'ε' and 'D1' containing nodes o1 through o5.
* **t=5:** Similar to t=0 and t=1, with 'ε' and 'D5' containing nodes o1 through o5.
4. **Output Correspondences:** The final stage produces the output correspondences, represented by nodes c1 through c5.
The nodes within the encoder and decoder blocks (c1-c5 and o1-o5) appear to represent the same underlying entities, but their representation changes as they are processed through the network. The arrows within the decoder blocks suggest a dynamic process where the relationships between the nodes are updated at each time step.
### Key Observations
* The network architecture is sequential, with information flowing from the filtering stage through the encoder and then through the decoder.
* The decoder operates iteratively, refining the correspondences over multiple time steps.
* The use of 'ε' within the decoder blocks suggests a potential input or transformation at each time step.
* The diagram does not provide any numerical values or specific details about the transformations performed by the encoder and decoder.
### Interpretation
This diagram depicts a neural network designed to learn and refine correspondences between entities. The initial correspondence filtering stage likely represents a pre-processing step to identify potential relationships. The encoder then learns a compressed representation of these relationships, and the decoder uses this representation to generate more accurate or refined correspondences over time. The iterative nature of the decoder suggests that the network is capable of capturing complex dependencies between the entities. The diagram is a high-level overview of the architecture and does not provide details about the specific algorithms or parameters used. It is a conceptual illustration of a correspondence learning process, likely used in tasks such as image matching, object tracking, or point cloud registration. The diagram is a visual representation of a mathematical model, and its effectiveness depends on the specific implementation and training data.