\n
## Time Series Charts: Rainfall Prediction Comparison
### Overview
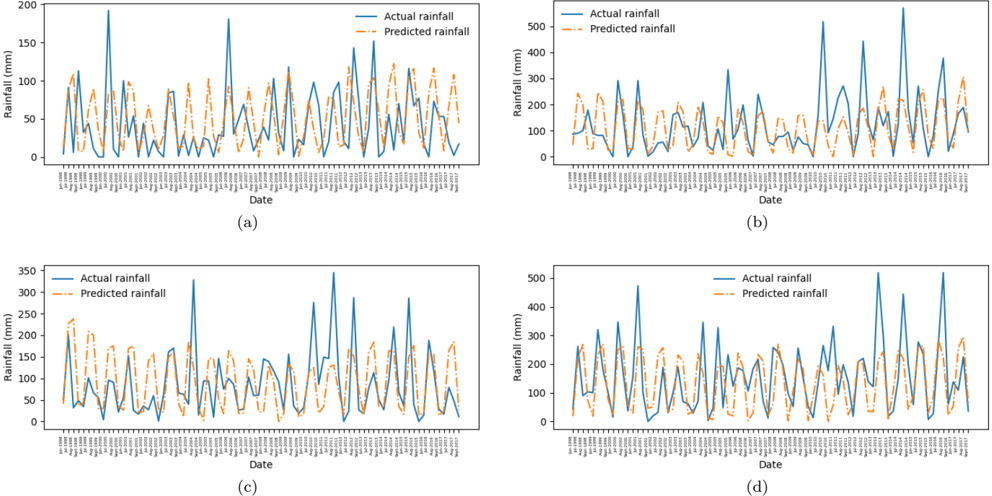
The image presents four time series charts (labeled a, b, c, and d) comparing actual rainfall amounts to predicted rainfall amounts over a period of time. Each chart displays rainfall (in millimeters) on the y-axis against date on the x-axis. The charts appear to be evaluating the performance of a rainfall prediction model.
### Components/Axes
Each chart shares the following components:
* **X-axis:** Labeled "Date". The scale is not explicitly marked, but appears to represent a continuous time period.
* **Y-axis:** Labeled "Rainfall (mm)". The scale varies between charts.
* Chart (a): 0 to 200 mm
* Chart (b): 0 to 500 mm
* Chart (c): 0 to 350 mm
* Chart (d): 0 to 500 mm
* **Legend:** Located in the top-left corner of each chart.
* "Actual rainfall" - Represented by a solid blue line.
* "Predicted rainfall" - Represented by a dashed orange line.
* **Labels:** Each chart is labeled with a lowercase letter (a, b, c, d) in the bottom-right corner.
### Detailed Analysis or Content Details
**Chart (a):**
The blue "Actual rainfall" line exhibits a highly oscillatory pattern with peaks reaching approximately 180 mm and troughs near 0 mm. The orange "Predicted rainfall" line generally follows the same oscillatory pattern, but with lower peak values, reaching around 120 mm, and a slight phase shift.
* Approximate peak values for Actual Rainfall: 180mm (occurs multiple times)
* Approximate peak values for Predicted Rainfall: 120mm (occurs multiple times)
**Chart (b):**
The "Actual rainfall" line shows larger oscillations, with peaks reaching approximately 450 mm and troughs near 0 mm. The "Predicted rainfall" line again follows the general trend, but with significantly lower peak values, around 250 mm, and a noticeable lag.
* Approximate peak values for Actual Rainfall: 450mm (occurs multiple times)
* Approximate peak values for Predicted Rainfall: 250mm (occurs multiple times)
**Chart (c):**
The "Actual rainfall" line oscillates between approximately 0 mm and 300 mm. The "Predicted rainfall" line shows a similar oscillatory pattern, but with a more dampened amplitude, peaking around 200 mm.
* Approximate peak values for Actual Rainfall: 300mm (occurs multiple times)
* Approximate peak values for Predicted Rainfall: 200mm (occurs multiple times)
**Chart (d):**
The "Actual rainfall" line exhibits oscillations reaching approximately 450 mm, with troughs near 0 mm. The "Predicted rainfall" line follows the trend, but with lower peaks, around 300 mm, and a phase shift.
* Approximate peak values for Actual Rainfall: 450mm (occurs multiple times)
* Approximate peak values for Predicted Rainfall: 300mm (occurs multiple times)
### Key Observations
* In all four charts, the predicted rainfall consistently underestimates the actual rainfall, particularly during peak rainfall events.
* The amplitude of the predicted rainfall is generally lower than the actual rainfall.
* There appears to be a phase shift between the actual and predicted rainfall in some charts, suggesting the model may be predicting rainfall slightly earlier or later than it occurs.
* The scale of rainfall varies between the charts, indicating potentially different time periods or locations being analyzed.
### Interpretation
The data suggests that the rainfall prediction model, while capturing the general oscillatory pattern of rainfall, consistently underestimates the actual rainfall amounts. This underestimation is more pronounced in charts (b) and (d), which exhibit higher rainfall values. The phase shifts observed in some charts indicate a potential timing issue with the predictions.
The differences between the charts (a, b, c, d) could represent different time periods, geographical locations, or model configurations. Further investigation would be needed to determine the specific reasons for these variations. The consistent underestimation suggests a systematic bias in the model, which could be addressed through model recalibration or the inclusion of additional predictive variables. The model appears to be better at predicting the *occurrence* of rainfall (capturing the peaks and troughs) than the *magnitude* of rainfall.