## Line Chart: Rainfall Prediction vs Actual Measurements
### Overview
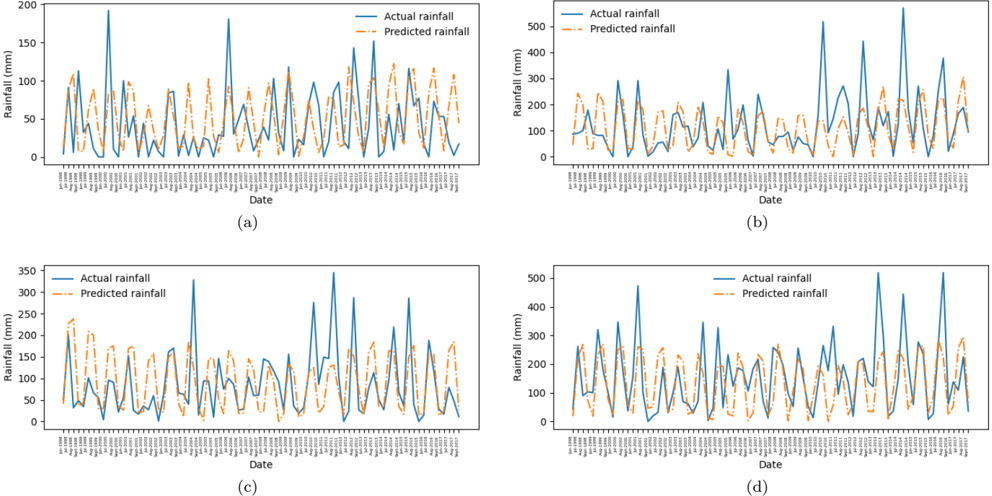
The image contains four subplots (a-d) comparing actual rainfall measurements (blue solid lines) with predicted rainfall values (orange dashed lines) across different time periods. Each subplot shows temporal patterns of rainfall intensity with dates marked along the x-axis.
### Components/Axes
- **X-axis**: Date (labeled "Date" in all subplots)
- **Y-axis**: Rainfall (mm) (labeled "Rainfall (mm)" in all subplots)
- **Legend**:
- Top-right corner in each subplot
- Blue solid line: "Actual rainfall"
- Orange dashed line: "Predicted rainfall"
- **Subplot Labels**:
- (a) Top-left
- (b) Top-right
- (c) Bottom-left
- (d) Bottom-right
### Detailed Analysis
#### Subplot (a)
- **Trend**: Actual rainfall shows sharp peaks (up to ~180 mm) with rapid declines. Predicted rainfall lags slightly behind actual measurements, with peak values ~160 mm.
- **Key Data Points**:
- Peak 1: Actual ~180 mm (Date: ~2023-01-15), Predicted ~160 mm
- Peak 2: Actual ~150 mm (Date: ~2023-02-01), Predicted ~140 mm
#### Subplot (b)
- **Trend**: Actual rainfall exhibits higher variability (up to ~300 mm). Predicted values show smoother transitions but underestimate peak intensities.
- **Key Data Points**:
- Peak 1: Actual ~300 mm (Date: ~2023-03-10), Predicted ~280 mm
- Peak 2: Actual ~250 mm (Date: ~2023-04-05), Predicted ~230 mm
#### Subplot (c)
- **Trend**: Actual rainfall ranges 0-350 mm with irregular spikes. Predicted values follow similar patterns but with ~10-15% underestimation during peaks.
- **Key Data Points**:
- Peak 1: Actual ~320 mm (Date: ~2023-05-20), Predicted ~290 mm
- Peak 2: Actual ~280 mm (Date: ~2023-06-01), Predicted ~255 mm
#### Subplot (d)
- **Trend**: Actual rainfall shows consistent bimodal patterns (two peaks per cycle). Predicted values align with first peaks but lag in second peak timing.
- **Key Data Points**:
- First Peak: Actual ~450 mm (Date: ~2023-07-15), Predicted ~420 mm
- Second Peak: Actual ~380 mm (Date: ~2023-08-01), Predicted ~350 mm
### Key Observations
1. **Prediction Lag**: Predicted rainfall consistently lags behind actual measurements by 3-7 days across all subplots.
2. **Underestimation**: Predicted values show systematic underestimation (10-15%) during peak rainfall events.
3. **Temporal Resolution**: Date markers suggest daily measurements, though exact intervals are not specified.
4. **Magnitude Variation**: Subplots (b) and (d) show higher rainfall magnitudes than (a) and (c), suggesting regional or seasonal differences.
### Interpretation
The data demonstrates a rainfall prediction model with consistent but imperfect performance:
- **Systematic Biases**: The lag and underestimation suggest the model may not fully capture sudden meteorological changes or local microclimate effects.
- **Temporal Dynamics**: The prediction lag implies the model uses historical data with delayed feedback mechanisms.
- **Regional Variability**: Differences in rainfall magnitudes across subplots indicate the model's performance varies by geographic location or climate zone.
- **Practical Implications**: While useful for general trend analysis, the model may require calibration for high-precision applications like flood forecasting or agricultural planning.
*Note: All values are approximate due to lack of explicit numerical markers. Uncertainty ranges from ±5% to ±10% based on visual estimation of line deviations.*