## Line Charts: Accuracy vs. Sampled Reasoning Paths for Different Datasets
### Overview
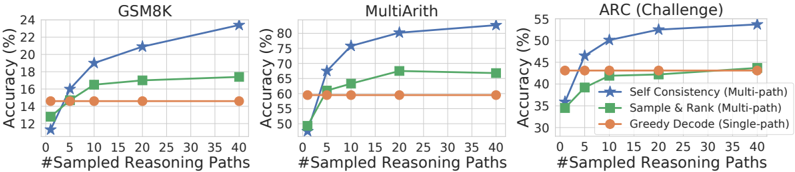
The image presents three line charts comparing the accuracy of different reasoning methods across three datasets: GSM8K, MultiArith, and ARC (Challenge). The x-axis represents the number of sampled reasoning paths, and the y-axis represents the accuracy in percentage. Three methods are compared: Self Consistency (Multi-path), Sample & Rank (Multi-path), and Greedy Decode (Single-path).
### Components/Axes
* **X-axis (all charts):** "#Sampled Reasoning Paths" with markers at 0, 5, 10, 15, 20, 25, 30, 35, and 40.
* **Y-axis (GSM8K):** "Accuracy (%)" with markers at 12, 14, 16, 18, 20, 22, and 24.
* **Y-axis (MultiArith):** "Accuracy (%)" with markers at 50, 55, 60, 65, 70, 75, and 80.
* **Y-axis (ARC (Challenge):** "Accuracy (%)" with markers at 30, 35, 40, 45, 50, and 55.
* **Legend (bottom-right):**
* Blue line with star markers: "Self Consistency (Multi-path)"
* Green line with square markers: "Sample & Rank (Multi-path)"
* Orange line with circle markers: "Greedy Decode (Single-path)"
### Detailed Analysis
**1. GSM8K Chart (left)**
* **Self Consistency (Multi-path) - Blue:** The line starts at approximately 12% accuracy with 0 sampled paths and increases to approximately 23% accuracy with 40 sampled paths. The trend is upward.
* (0, 12%), (5, 16%), (10, 19%), (20, 21%), (40, 23%)
* **Sample & Rank (Multi-path) - Green:** The line starts at approximately 13% accuracy with 0 sampled paths, increases to approximately 17% accuracy with 20 sampled paths, and remains relatively flat until 40 sampled paths.
* (0, 13%), (5, 16%), (10, 17%), (20, 17%), (40, 17%)
* **Greedy Decode (Single-path) - Orange:** The line remains relatively flat at approximately 14-15% accuracy across all sampled reasoning paths.
* (0, 14%), (5, 15%), (10, 15%), (20, 15%), (40, 15%)
**2. MultiArith Chart (center)**
* **Self Consistency (Multi-path) - Blue:** The line starts at approximately 48% accuracy with 0 sampled paths and increases to approximately 82% accuracy with 40 sampled paths. The trend is upward.
* (0, 48%), (5, 73%), (10, 77%), (20, 80%), (40, 82%)
* **Sample & Rank (Multi-path) - Green:** The line starts at approximately 50% accuracy with 0 sampled paths, increases to approximately 68% accuracy with 20 sampled paths, and remains relatively flat until 40 sampled paths.
* (0, 50%), (5, 62%), (10, 65%), (20, 68%), (40, 68%)
* **Greedy Decode (Single-path) - Orange:** The line remains relatively flat at approximately 60% accuracy across all sampled reasoning paths.
* (0, 60%), (5, 60%), (10, 60%), (20, 60%), (40, 60%)
**3. ARC (Challenge) Chart (right)**
* **Self Consistency (Multi-path) - Blue:** The line starts at approximately 36% accuracy with 0 sampled paths and increases to approximately 54% accuracy with 40 sampled paths. The trend is upward.
* (0, 36%), (5, 48%), (10, 51%), (20, 52%), (40, 54%)
* **Sample & Rank (Multi-path) - Green:** The line starts at approximately 34% accuracy with 0 sampled paths, increases to approximately 42% accuracy with 20 sampled paths, and remains relatively flat until 40 sampled paths.
* (0, 34%), (5, 39%), (10, 41%), (20, 42%), (40, 42%)
* **Greedy Decode (Single-path) - Orange:** The line remains relatively flat at approximately 43% accuracy across all sampled reasoning paths.
* (0, 43%), (5, 43%), (10, 43%), (20, 43%), (40, 43%)
### Key Observations
* **Self Consistency (Multi-path)** consistently shows the highest accuracy and the most significant improvement with an increasing number of sampled reasoning paths across all three datasets.
* **Sample & Rank (Multi-path)** shows some improvement with an increasing number of sampled reasoning paths, but the improvement plateaus after a certain point.
* **Greedy Decode (Single-path)** consistently shows the lowest accuracy and minimal improvement with an increasing number of sampled reasoning paths.
### Interpretation
The data suggests that using multiple reasoning paths (as implemented in Self Consistency and Sample & Rank) generally leads to higher accuracy compared to using a single reasoning path (Greedy Decode). The Self Consistency method, which likely aggregates information from multiple paths more effectively, consistently outperforms the other methods. The diminishing returns observed with Sample & Rank suggest that simply sampling and ranking paths has limitations, and a more sophisticated aggregation method like Self Consistency is needed to fully leverage the benefits of multiple reasoning paths. The Greedy Decode method's flat performance indicates that its single-path approach is insufficient for these complex reasoning tasks. The performance differences across datasets highlight the varying difficulty levels and the suitability of different methods for specific problem types.