## Line Charts: Performance Comparison of Reasoning Methods
### Overview
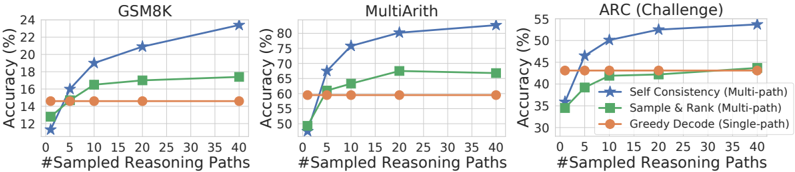
The image displays three side-by-side line charts comparing the accuracy of three different reasoning methods across three distinct datasets: **GSM8K**, **MultiArith**, and **ARC (Challenge)**. The X-axis represents the number of sampled reasoning paths, while the Y-axis represents accuracy in percentage.
### Components/Axes
* **X-Axis (All charts):** "#Sampled Reasoning Paths" with markers at 0, 5, 10, 15, 20, 25, 30, 35, 40.
* **Y-Axis (All charts):** "Accuracy (%)".
* GSM8K: Scale from 12 to 24.
* MultiArith: Scale from 50 to 80.
* ARC (Challenge): Scale from 30 to 55.
* **Legend (Located in the bottom-right of the ARC chart):**
* **Blue Star:** Self Consistency (Multi-path)
* **Green Square:** Sample & Rank (Multi-path)
* **Orange Circle:** Greedy Decode (Single-path)
---
### Detailed Analysis
#### 1. GSM8K Chart (Left)
* **Trend Verification:** All multi-path methods show an upward trend. The Blue line (Self Consistency) shows the steepest growth. The Orange line is perfectly horizontal.
* **Data Points (Approximate):**
* **Self Consistency (Blue Star):** Starts at ~11.5% (at 1 path), rises to ~16% (at 5), ~19% (at 10), ~21% (at 20), and reaches ~23.5% (at 40).
* **Sample & Rank (Green Square):** Starts at ~13% (at 1), rises to ~15% (at 5), ~16.5% (at 10), ~17% (at 20), and ~17.5% (at 40).
* **Greedy Decode (Orange Circle):** Remains constant at ~14.5% across all path counts.
#### 2. MultiArith Chart (Center)
* **Trend Verification:** Both multi-path methods show significant upward trends, with Self Consistency showing the most aggressive growth. The Orange line is horizontal.
* **Data Points (Approximate):**
* **Self Consistency (Blue Star):** Starts at ~48% (at 1), rises sharply to ~68% (at 5), ~76% (at 10), ~80% (at 20), and ~82% (at 40).
* **Sample & Rank (Green Square):** Starts at ~49% (at 1), rises to ~61% (at 5), ~63% (at 10), ~67% (at 20), and plateaus at ~67% (at 40).
* **Greedy Decode (Orange Circle):** Remains constant at ~60% across all path counts.
#### 3. ARC (Challenge) Chart (Right)
* **Trend Verification:** Both multi-path methods show upward trends. The Orange line is horizontal.
* **Data Points (Approximate):**
* **Self Consistency (Blue Star):** Starts at ~36% (at 1), rises to ~46% (at 5), ~50% (at 10), ~52% (at 20), and ~54% (at 40).
* **Sample & Rank (Green Square):** Starts at ~35% (at 1), rises to ~39% (at 5), ~42% (at 10), ~42% (at 20), and ~44% (at 40).
* **Greedy Decode (Orange Circle):** Remains constant at ~43% across all path counts.
---
### Key Observations
* **Dominance of Self Consistency:** The "Self Consistency" method (Blue Star) consistently achieves the highest accuracy across all three datasets as the number of sampled paths increases.
* **Diminishing Returns:** For all multi-path methods, the most significant accuracy gains occur between 1 and 20 paths. The slope of the curves flattens significantly between 20 and 40 paths, suggesting that increasing the sample size beyond 20 yields marginal improvements.
* **Baseline Performance:** The "Greedy Decode" (Orange Circle) acts as a static baseline. In all cases, multi-path methods eventually surpass this baseline, though "Sample & Rank" performs worse than "Greedy Decode" at very low path counts (1 path) in the ARC dataset.
### Interpretation
The data demonstrates that **multi-path reasoning strategies** (Self Consistency and Sample & Rank) are superior to single-path strategies (Greedy Decode) when sufficient computational budget (sampled paths) is available.
* **Why it matters:** This suggests that for complex reasoning tasks, generating multiple potential solutions and aggregating them (Self Consistency) is a highly effective way to improve model reliability.
* **Efficiency Trade-off:** The "elbow" in the curves (around 20 paths) indicates an optimal operational point. Increasing paths from 20 to 40 provides relatively little accuracy gain compared to the jump from 1 to 20, implying that 20 paths is likely the most efficient configuration for these specific tasks.
* **Methodological Insight:** The fact that "Sample & Rank" (Green) often plateaus earlier or lower than "Self Consistency" (Blue) suggests that the aggregation mechanism in Self Consistency is more robust at extracting correct answers from a pool of candidates than the ranking mechanism in Sample & Rank.