## Line Charts: Performance of Reasoning Methods Across Datasets
### Overview
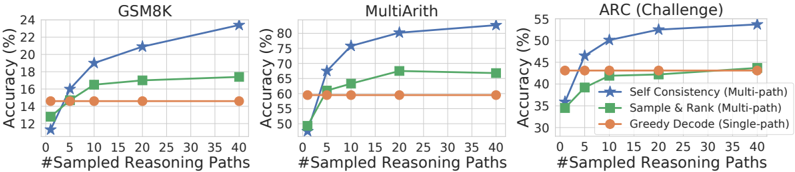
The image displays three horizontally arranged line charts comparing the accuracy of three different reasoning methods as the number of sampled reasoning paths increases. The charts are titled "GSM8K", "MultiArith", and "ARC (Challenge)". Each chart plots "Accuracy (%)" on the y-axis against "#Sampled Reasoning Paths" on the x-axis.
### Components/Axes
* **Titles (Top-Center of each chart):** GSM8K, MultiArith, ARC (Challenge).
* **Y-Axis Label (Left side, rotated):** "Accuracy (%)".
* **X-Axis Label (Bottom center):** "#Sampled Reasoning Paths".
* **X-Axis Scale (All charts):** Linear scale with major ticks at 0, 5, 10, 20, 30, and 40.
* **Y-Axis Scales:**
* **GSM8K:** Ranges from 12 to 24, with major ticks every 2 units (12, 14, 16, 18, 20, 22, 24).
* **MultiArith:** Ranges from 50 to 80, with major ticks every 5 units (50, 55, 60, 65, 70, 75, 80).
* **ARC (Challenge):** Ranges from 30 to 55, with major ticks every 5 units (30, 35, 40, 45, 50, 55).
* **Legend (Bottom-right of each chart):**
* **Blue line with star markers:** "Self Consistency (Multi-path)"
* **Green line with square markers:** "Sample & Rank (Multi-path)"
* **Orange line with circle markers:** "Greedy Decode (Single-path)"
### Detailed Analysis
**Chart 1: GSM8K**
* **Trend Verification:**
* **Self Consistency (Blue):** Shows a strong, consistent upward slope from left to right.
* **Sample & Rank (Green):** Shows a moderate upward slope, flattening after 10 paths.
* **Greedy Decode (Orange):** Appears as a perfectly horizontal line.
* **Data Points (Approximate):**
* **Self Consistency:** (0, ~12%), (5, ~16%), (10, ~19%), (20, ~21%), (40, ~24%).
* **Sample & Rank:** (0, ~14%), (5, ~16%), (10, ~17%), (20, ~17.5%), (40, ~18%).
* **Greedy Decode:** Constant at ~15% for all x-values.
**Chart 2: MultiArith**
* **Trend Verification:**
* **Self Consistency (Blue):** Steep upward slope initially, then continues rising steadily.
* **Sample & Rank (Green):** Moderate upward slope, plateauing after 20 paths.
* **Greedy Decode (Orange):** Horizontal line.
* **Data Points (Approximate):**
* **Self Consistency:** (0, ~50%), (5, ~68%), (10, ~76%), (20, ~80%), (40, ~82%).
* **Sample & Rank:** (0, ~50%), (5, ~60%), (10, ~64%), (20, ~68%), (40, ~67%).
* **Greedy Decode:** Constant at ~60% for all x-values.
**Chart 3: ARC (Challenge)**
* **Trend Verification:**
* **Self Consistency (Blue):** Steady upward slope.
* **Sample & Rank (Green):** Moderate upward slope.
* **Greedy Decode (Orange):** Nearly horizontal, with a very slight upward drift.
* **Data Points (Approximate):**
* **Self Consistency:** (0, ~35%), (5, ~47%), (10, ~50%), (20, ~53%), (40, ~55%).
* **Sample & Rank:** (0, ~35%), (5, ~40%), (10, ~42%), (20, ~44%), (40, ~45%).
* **Greedy Decode:** Starts at ~42% (x=0), ends at ~43% (x=40).
### Key Observations
1. **Consistent Hierarchy:** Across all three datasets, the "Self Consistency (Multi-path)" method (blue) achieves the highest final accuracy, followed by "Sample & Rank (Multi-path)" (green), with "Greedy Decode (Single-path)" (orange) performing the worst or being static.
2. **Impact of Multi-Path Sampling:** Both multi-path methods (blue and green lines) show clear improvement as the number of sampled reasoning paths increases from 0 to 40. The improvement is most dramatic for "Self Consistency."
3. **Plateau Effect:** The "Sample & Rank" method shows diminishing returns, with its accuracy curve flattening significantly after 10-20 sampled paths in all charts.
4. **Baseline Performance:** The "Greedy Decode" line serves as a flat baseline, as it is a single-path method and its performance does not change with the x-axis variable (#Sampled Reasoning Paths). Its starting point (x=0) represents the single-path accuracy.
5. **Dataset Difficulty:** The absolute accuracy values suggest the relative difficulty of the tasks. GSM8K has the lowest overall accuracy range (12-24%), ARC (Challenge) is in the middle (35-55%), and MultiArith has the highest (50-82%).
### Interpretation
The data demonstrates the significant benefit of **multi-path reasoning and aggregation strategies** over a single greedy decode for improving accuracy on mathematical and reasoning benchmarks. The "Self Consistency" method, which likely involves sampling multiple reasoning paths and selecting the most frequent answer, shows the strongest scaling law with increased sampling compute.
The "Sample & Rank" method also benefits from sampling but appears less effective at leveraging additional paths beyond a certain point (around 20), suggesting its ranking mechanism may have a lower ceiling or be more sensitive to the quality of the initial sample pool.
The flat "Greedy Decode" line is a critical control, confirming that the observed improvements are due to the multi-path sampling and aggregation process, not an artifact of the evaluation. The charts collectively argue that investing computational resources into generating and evaluating multiple reasoning traces is a highly effective strategy for boosting the performance of language models on complex tasks, with "Self Consistency" being the most efficient method among those compared.