## Chart: LM Loss vs. PFLOP/s-days for MoBA and Full Attention Projections
### Overview
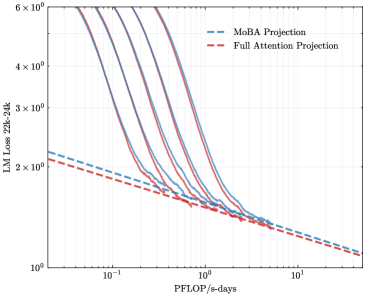
The image is a line chart comparing the Language Model (LM) Loss for MoBA Projection and Full Attention Projection across varying computational resources (PFLOP/s-days). The y-axis represents LM Loss from 22k to 24k, and the x-axis represents PFLOP/s-days. The chart includes multiple lines for each projection type, showing the loss trend as computational resources increase.
### Components/Axes
* **Title:** LM Loss 22k-24k
* **X-axis:** PFLOP/s-days (logarithmic scale)
* Axis markers: 10<sup>-1</sup>, 10<sup>0</sup>, 10<sup>1</sup>
* **Y-axis:** LM Loss 22k-24k (logarithmic scale)
* Axis markers: 2 x 10<sup>0</sup>, 3 x 10<sup>0</sup>, 4 x 10<sup>0</sup>, 6 x 10<sup>0</sup>
* **Legend:** Located at the top-right of the chart.
* MoBA Projection (dashed blue line)
* Full Attention Projection (dashed red line)
### Detailed Analysis
* **MoBA Projection:**
* There are multiple solid blue lines representing different MoBA projections.
* Trend: All MoBA projection lines show a steep decrease in LM Loss as PFLOP/s-days increase initially, then the rate of decrease slows down.
* Approximate values:
* At 0.1 PFLOP/s-days, the LM Loss ranges from approximately 3.5 x 10<sup>0</sup> to 5.5 x 10<sup>0</sup>.
* At 1 PFLOP/s-days, the LM Loss ranges from approximately 1.5 x 10<sup>0</sup> to 2 x 10<sup>0</sup>.
* At 10 PFLOP/s-days, the LM Loss converges to approximately 1.2 x 10<sup>0</sup>.
* **Full Attention Projection:**
* Represented by a dashed red line.
* Trend: The Full Attention Projection line shows a consistent decrease in LM Loss as PFLOP/s-days increase.
* Approximate values:
* At 0.1 PFLOP/s-days, the LM Loss is approximately 2.2 x 10<sup>0</sup>.
* At 1 PFLOP/s-days, the LM Loss is approximately 1.4 x 10<sup>0</sup>.
* At 10 PFLOP/s-days, the LM Loss is approximately 1.1 x 10<sup>0</sup>.
### Key Observations
* The MoBA projections initially have higher LM Loss compared to the Full Attention Projection at lower PFLOP/s-days.
* As PFLOP/s-days increase, the LM Loss for both MoBA and Full Attention Projections converges.
* The rate of decrease in LM Loss for MoBA projections slows down significantly as PFLOP/s-days increase.
### Interpretation
The chart suggests that while MoBA projections may initially perform worse than Full Attention Projection in terms of LM Loss at lower computational resources, their performance improves significantly with increased computational resources. The convergence of LM Loss at higher PFLOP/s-days indicates that both methods can achieve similar performance levels given sufficient computational power. The multiple lines for MoBA projection likely represent different configurations or variations of the MoBA model, showing a range of possible performance outcomes. The Full Attention Projection serves as a baseline for comparison, demonstrating a more consistent but potentially less scalable performance trend.