\n
## Chart: LM Loss vs. PFLOP/s-days
### Overview
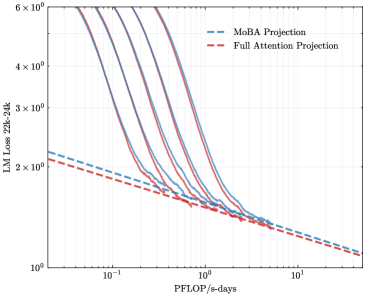
The image presents a line chart comparing the Language Model (LM) Loss for two projection methods: MoBA Projection and Full Attention Projection, plotted against PFLOP/s-days. Multiple lines are shown for each projection method, likely representing different runs or configurations. The chart uses a logarithmic scale for the y-axis (LM Loss) and a logarithmic scale for the x-axis (PFLOP/s-days).
### Components/Axes
* **X-axis:** PFLOP/s-days, ranging from approximately 10<sup>-1</sup> to 10<sup>1</sup> (logarithmic scale).
* **Y-axis:** LM Loss 22k-24k, ranging from approximately 10<sup>0</sup> to 6 x 10<sup>6</sup> (logarithmic scale).
* **Legend:** Located in the top-right corner.
* MoBA Projection (Blue, dashed lines)
* Full Attention Projection (Red, solid lines)
* **Data Series:** Multiple lines for each projection method. There are approximately 6 lines for each method.
### Detailed Analysis
**MoBA Projection (Blue, dashed lines):**
The MoBA Projection lines generally slope downward, indicating that as PFLOP/s-days increase, the LM Loss decreases.
* Line 1: Starts at approximately 2 x 10<sup>3</sup> at 10<sup>-1</sup> PFLOP/s-days, decreasing to approximately 2 x 10<sup>2</sup> at 10<sup>1</sup> PFLOP/s-days.
* Line 2: Starts at approximately 1 x 10<sup>3</sup> at 10<sup>-1</sup> PFLOP/s-days, decreasing to approximately 1 x 10<sup>2</sup> at 10<sup>1</sup> PFLOP/s-days.
* Line 3: Starts at approximately 8 x 10<sup>2</sup> at 10<sup>-1</sup> PFLOP/s-days, decreasing to approximately 8 x 10<sup>1</sup> at 10<sup>1</sup> PFLOP/s-days.
* Line 4: Starts at approximately 6 x 10<sup>2</sup> at 10<sup>-1</sup> PFLOP/s-days, decreasing to approximately 6 x 10<sup>1</sup> at 10<sup>1</sup> PFLOP/s-days.
* Line 5: Starts at approximately 4 x 10<sup>2</sup> at 10<sup>-1</sup> PFLOP/s-days, decreasing to approximately 4 x 10<sup>1</sup> at 10<sup>1</sup> PFLOP/s-days.
* Line 6: Starts at approximately 2 x 10<sup>2</sup> at 10<sup>-1</sup> PFLOP/s-days, decreasing to approximately 2 x 10<sup>1</sup> at 10<sup>1</sup> PFLOP/s-days.
**Full Attention Projection (Red, solid lines):**
The Full Attention Projection lines also slope downward, but generally start at a higher LM Loss and exhibit more variance than the MoBA Projection lines.
* Line 1: Starts at approximately 5 x 10<sup>3</sup> at 10<sup>-1</sup> PFLOP/s-days, decreasing to approximately 3 x 10<sup>2</sup> at 10<sup>1</sup> PFLOP/s-days.
* Line 2: Starts at approximately 4 x 10<sup>3</sup> at 10<sup>-1</sup> PFLOP/s-days, decreasing to approximately 2 x 10<sup>2</sup> at 10<sup>1</sup> PFLOP/s-days.
* Line 3: Starts at approximately 3 x 10<sup>3</sup> at 10<sup>-1</sup> PFLOP/s-days, decreasing to approximately 1.5 x 10<sup>2</sup> at 10<sup>1</sup> PFLOP/s-days.
* Line 4: Starts at approximately 2.5 x 10<sup>3</sup> at 10<sup>-1</sup> PFLOP/s-days, decreasing to approximately 1 x 10<sup>2</sup> at 10<sup>1</sup> PFLOP/s-days.
* Line 5: Starts at approximately 2 x 10<sup>3</sup> at 10<sup>-1</sup> PFLOP/s-days, decreasing to approximately 5 x 10<sup>1</sup> at 10<sup>1</sup> PFLOP/s-days.
* Line 6: Starts at approximately 1.5 x 10<sup>3</sup> at 10<sup>-1</sup> PFLOP/s-days, decreasing to approximately 2.5 x 10<sup>1</sup> at 10<sup>1</sup> PFLOP/s-days.
### Key Observations
* Both projection methods demonstrate a clear negative correlation between PFLOP/s-days and LM Loss. Increasing computational resources (PFLOP/s-days) leads to a reduction in LM Loss.
* The Full Attention Projection generally starts with a higher LM Loss than the MoBA Projection.
* The variance in LM Loss for the Full Attention Projection appears to be greater than that of the MoBA Projection, suggesting potentially more sensitivity to variations in the training process.
* The lines converge as PFLOP/s-days increase, indicating that the difference in performance between the two methods diminishes with more computational resources.
### Interpretation
The chart suggests that both MoBA Projection and Full Attention Projection are effective methods for reducing LM Loss. However, MoBA Projection appears to be more efficient in terms of achieving lower loss for a given amount of computational resources (PFLOP/s-days). The convergence of the lines at higher PFLOP/s-days suggests that Full Attention Projection can achieve comparable performance to MoBA Projection, but requires significantly more computational effort. The multiple lines for each method likely represent different training runs, highlighting the inherent variability in the training process. The logarithmic scales on both axes emphasize the rapid initial decrease in LM Loss with increasing PFLOP/s-days, followed by a slower rate of improvement as the model converges. This data is valuable for understanding the trade-offs between computational cost and model performance when choosing a projection method for language modeling.