\n
## Line Chart: LLM Loss vs. Computational Cost (PFLOP/s-days)
### Overview
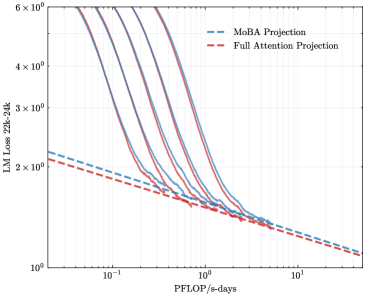
The image is a technical line chart comparing the performance scaling of two different projection methods for Large Language Models (LLMs). It plots model loss (a measure of error, where lower is better) against a metric of computational cost. The chart uses logarithmic scales on both axes to display data spanning multiple orders of magnitude.
### Components/Axes
* **Chart Type:** Log-log line chart.
* **X-Axis:**
* **Label:** `PFLOP/s-days`
* **Scale:** Logarithmic.
* **Range:** Approximately from `10^-1` (0.1) to `10^1` (10).
* **Markers:** Major ticks at `10^-1`, `10^0` (1), and `10^1`.
* **Y-Axis:**
* **Label:** `LLM Loss 22B-38B`
* **Scale:** Logarithmic.
* **Range:** From `10^0` (1) to `6 × 10^0` (6).
* **Markers:** Major ticks at `10^0`, `2 × 10^0`, `3 × 10^0`, `4 × 10^0`, and `6 × 10^0`.
* **Legend:**
* **Position:** Top-right corner of the plot area.
* **Entry 1:** `MoBA Projection` - Represented by a blue dashed line (`---`).
* **Entry 2:** `Full Attention Projection` - Represented by a red dashed line (`---`).
* **Data Series:** The chart contains multiple solid lines (approximately 5-6) in varying shades of purple and blue. These are not explicitly labeled in the legend but represent different model configurations or training runs. Two dashed projection lines (blue and red) are overlaid.
### Detailed Analysis
* **Trend of Solid Lines (Model Runs):** All solid lines exhibit a strong, consistent downward trend from left to right. They start at high loss values (between ~4 and >6) at low computational cost (~0.1 PFLOP/s-days) and decrease rapidly as cost increases. The curves begin to flatten and converge as they move towards the right side of the chart.
* **Trend of Dashed Projection Lines:** Both projection lines show a much shallower, linear downward slope on this log-log plot, indicating a power-law relationship.
* The **blue dashed line (`MoBA Projection`)** is consistently positioned **above** the red dashed line across the entire x-axis range.
* The **red dashed line (`Full Attention Projection`)** is consistently the lowest line on the chart for any given x-value.
* **Intersection and Convergence:** The solid model run lines appear to converge towards and align with the dashed projection lines in the region between `10^0` (1) and `10^1` (10) PFLOP/s-days. The solid lines seem to transition from a steeper initial descent to follow the shallower slope of the projections at higher compute.
* **Approximate Data Points (Visual Estimation):**
* At **~0.1 PFLOP/s-days**: Solid lines have loss values ranging from ~4 to >6. The red projection line is at ~2.2, and the blue projection line is at ~2.4.
* At **~1 PFLOP/s-days**: Solid lines have converged significantly, with loss values clustered between ~1.8 and ~2.2. The red projection is at ~1.8, and the blue projection is at ~1.9.
* At **~10 PFLOP/s-days**: All lines (solid and dashed) are tightly grouped, with loss values just above `10^0` (1), approximately in the range of 1.1 to 1.3.
### Key Observations
1. **Clear Scaling Law:** The data demonstrates a classic power-law scaling relationship between model performance (loss) and computational resources (PFLOP/s-days), as evidenced by the linear trends on the log-log plot.
2. **Projection Divergence:** There is a persistent, small but visible gap between the `MoBA Projection` (blue) and the `Full Attention Projection` (red). The Full Attention projection predicts slightly better (lower) loss for the same computational budget.
3. **Empirical Convergence:** The actual model training runs (solid lines) appear to validate the projection trends, especially at higher compute levels, where they align closely with the projected slopes.
4. **Initial Variance, Final Convergence:** Models starting with different loss values at low compute show a tendency to converge in performance as more computation is applied.
### Interpretation
This chart is a tool for predicting the performance of large language models based on computational investment. It compares two theoretical projection methods (`MoBA` and `Full Attention`) against empirical training data.
* **What the Data Suggests:** The close alignment between the solid training lines and the dashed projection lines at higher compute values suggests that these projection methods are effective for forecasting model performance in the high-compute regime. The consistent gap between the red and blue projections indicates that the choice of projection methodology (MoBA vs. Full Attention) leads to systematically different performance forecasts, with Full Attention being more optimistic.
* **How Elements Relate:** The x-axis (compute) is the independent variable driving the reduction in the y-axis (loss). The legend defines the two predictive models being tested. The solid lines serve as the ground truth against which the projections are validated.
* **Notable Implications:** For a practitioner, this chart implies that investing more compute reliably improves model performance following a predictable trend. Furthermore, it highlights that the `Full Attention Projection` method may be the more favorable (or perhaps more accurate) benchmark for planning large-scale training runs, as it predicts a lower loss for a given budget. The convergence of all lines at the far right suggests a region of diminishing returns, where massive increases in compute yield smaller absolute improvements in loss.