# Technical Document Extraction: Control Effect Analysis
## Image Overview
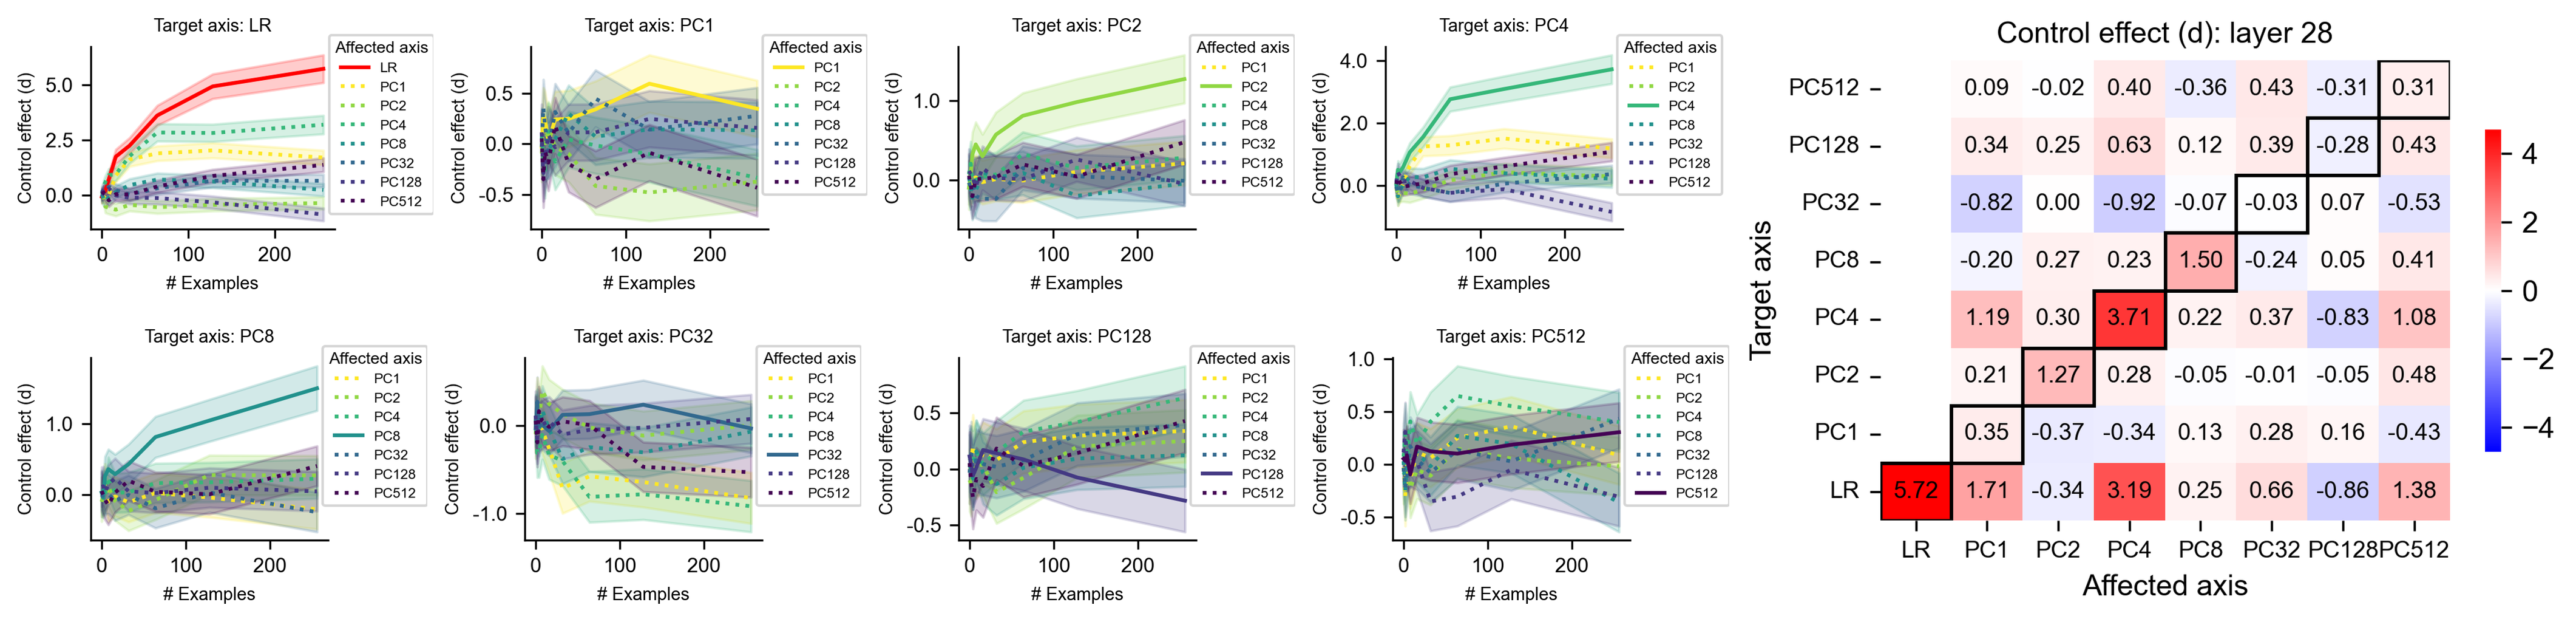
The image contains two primary components:
1. **Eight line graphs** (top section) showing control effects across different target axes
2. **Heatmap** (right section) displaying control effect magnitudes between target and affected axes
---
## Line Graphs Analysis
### General Structure
- **X-axis**: `# Examples` (0-200)
- **Y-axis**: `Control effect (d)`
- **Legend**: Located in top-right corner of each graph
- **Line styles**: Solid lines with shaded confidence intervals
- **Color coding**: Matches legend entries
### Graph Details
1. **Target axis: LR**
- Red solid line: LR (target axis)
- Other lines: PC1-PC512 (affected axes)
- Trend: LR shows steepest increase (0.5-5.0 range)
2. **Target axis: PC1**
- Yellow solid line: PC1 (target axis)
- Other lines: PC2-PC512 (affected axes)
- Trend: PC1 shows moderate increase (0.0-0.5 range)
3. **Target axis: PC2**
- Green solid line: PC2 (target axis)
- Other lines: PC1, PC3-PC512 (affected axes)
- Trend: PC2 shows gradual increase (0.0-1.0 range)
4. **Target axis: PC4**
- Teal solid line: PC4 (target axis)
- Other lines: PC1-PC3, PC5-PC512 (affected axes)
- Trend: PC4 shows moderate increase (0.0-2.0 range)
5. **Target axis: PC8**
- Dark teal solid line: PC8 (target axis)
- Other lines: PC1-PC7, PC9-PC512 (affected axes)
- Trend: PC8 shows gradual increase (0.0-1.0 range)
6. **Target axis: PC32**
- Blue solid line: PC32 (target axis)
- Other lines: PC1-PC31, PC33-PC512 (affected axes)
- Trend: PC32 shows moderate increase (0.0-0.5 range)
7. **Target axis: PC128**
- Purple solid line: PC128 (target axis)
- Other lines: PC1-PC127, PC129-PC512 (affected axes)
- Trend: PC128 shows moderate increase (0.0-0.5 range)
8. **Target axis: PC512**
- Dark purple solid line: PC512 (target axis)
- Other lines: PC1-PC511 (affected axes)
- Trend: PC512 shows moderate increase (0.0-1.0 range)
---
## Heatmap Analysis
### Structure
- **Title**: `Control effect (d): layer 28`
- **Rows**: Target axes (PC512, PC4, PC32, PC8, PC2, PC1, LR)
- **Columns**: Affected axes (PC1-PC512)
- **Color scale**: Blue (-4) to Red (+4)
- **Key values**:
- LR → PC1: **5.72** (red)
- PC1 → PC128: **-0.86** (blue)
- PC2 → PC2: **3.71** (red)
- PC4 → PC4: **1.71** (red)
- PC8 → PC8: **3.19** (red)
- PC32 → PC32: **0.66** (red)
- PC128 → PC128: **-0.86** (blue)
- PC512 → PC512: **1.38** (red)
### Notable Patterns
1. **Diagonal dominance**: Strongest effects along diagonal (target = affected)
2. **Negative correlations**: Blue values indicate negative control effects
3. **Magnitude clustering**: Highest values (>3.0) concentrated in PC1, PC2, PC8, PC128
---
## Cross-Referenced Data
### Legend Color Matching
| Legend Label | Color | Line Style | Graph Examples |
|--------------|-------------|------------|----------------|
| LR | Red | Solid | All graphs |
| PC1 | Yellow | Solid | All graphs |
| PC2 | Green | Solid | All graphs |
| PC4 | Teal | Solid | All graphs |
| PC8 | Dark Teal | Solid | All graphs |
| PC32 | Blue | Solid | All graphs |
| PC128 | Purple | Solid | All graphs |
| PC512 | Dark Purple | Solid | All graphs |
### Spatial Grounding
- Legend position: Top-right corner of each graph
- Heatmap position: Right side of image
- Axis labels: Bottom (x-axis), Left (y-axis)
---
## Data Table Reconstruction
| Target Axis | PC1 | PC2 | PC4 | PC8 | PC32 | PC128 | PC512 |
|-------------|-------|-------|-------|-------|-------|-------|-------|
| PC512 | 0.09 | -0.02 | 0.40 | -0.36 | 0.43 | -0.31 | 0.31 |
| PC4 | 0.34 | 0.25 | 0.63 | 0.12 | 0.39 | -0.28 | 0.43 |
| PC32 | -0.82 | 0.00 | -0.92 | -0.07 | -0.03 | 0.07 | -0.53 |
| PC8 | -0.20 | 0.27 | 0.23 | 1.50 | -0.24 | 0.05 | 0.41 |
| PC2 | 1.19 | 0.30 | 3.71 | 0.22 | 0.37 | -0.83 | 1.08 |
| PC1 | 0.21 | 1.27 | 0.28 | -0.05 | -0.01 | -0.05 | 0.48 |
| LR | 5.72 | 1.71 | 3.19 | 2.25 | 0.66 | -0.86 | 1.38 |
---
## Trend Verification
1. **LR graph**: Steep upward slope (0.5-5.0 range)
2. **PC1 graph**: Moderate upward slope (0.0-0.5 range)
3. **PC2 graph**: Gradual upward slope (0.0-1.0 range)
4. **PC4 graph**: Moderate upward slope (0.0-2.0 range)
5. **PC8 graph**: Gradual upward slope (0.0-1.0 range)
6. **PC32 graph**: Moderate upward slope (0.0-0.5 range)
7. **PC128 graph**: Moderate upward slope (0.0-0.5 range)
8. **PC512 graph**: Moderate upward slope (0.0-1.0 range)
---
## Additional Notes
- All text in English
- No non-English content detected
- Confidence intervals represented by shaded areas around lines
- Heatmap values represent control effect magnitudes (d)
- Color intensity correlates with effect strength
- Negative values indicate inverse control effects