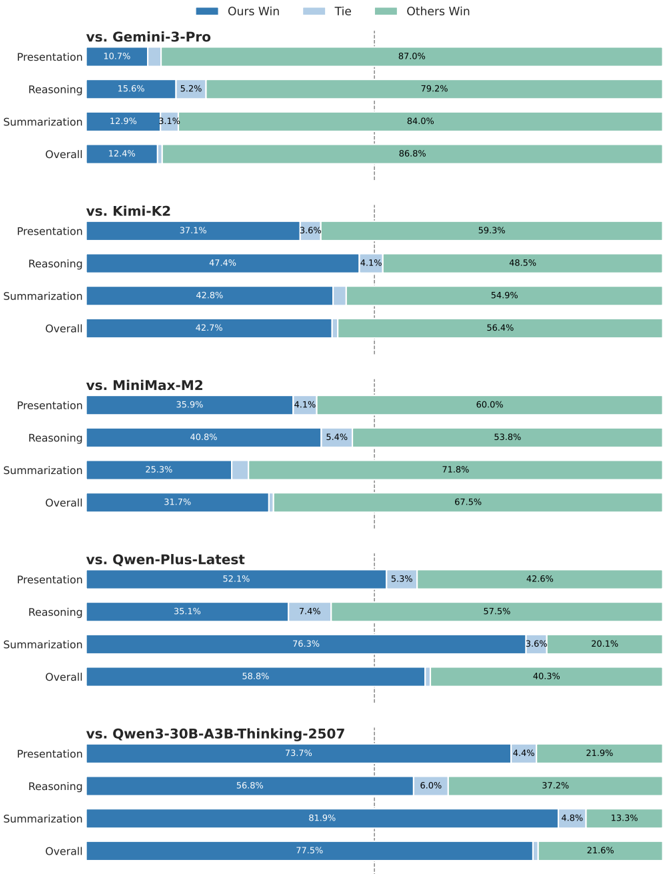
## Comparative Performance Bar Chart: Model Evaluation Results
### Overview
This image displays a series of five horizontal stacked bar charts, each comparing the performance of a model (referred to as "Ours") against a different competitor model across three specific tasks (Presentation, Reasoning, Summarization) and an Overall score. The chart uses a consistent color-coded legend to represent the outcome of each comparison.
### Components/Axes
* **Legend:** Located at the top center of the image.
* **Dark Blue:** "Ours Win"
* **Light Blue:** "Tie"
* **Green:** "Others Win"
* **Chart Structure:** Five vertically stacked panels, each with a header indicating the competitor model.
* **Y-Axis (Left Side of Each Panel):** Lists the evaluation categories: "Presentation", "Reasoning", "Summarization", and "Overall".
* **X-Axis (Implied):** Represents the percentage of evaluation outcomes, spanning from 0% to 100% across the width of each bar.
* **Data Labels:** Percentage values are printed directly on or adjacent to their corresponding colored bar segments.
### Detailed Analysis
The following data is extracted from each panel, reading from top to bottom.
**Panel 1: vs. Gemini-3-Pro**
* **Presentation:** Ours Win: 10.7%, Tie: (not visible, ~0%), Others Win: 87.0%
* **Reasoning:** Ours Win: 15.6%, Tie: 5.2%, Others Win: 79.2%
* **Summarization:** Ours Win: 12.9%, Tie: 3.1%, Others Win: 84.0%
* **Overall:** Ours Win: 12.4%, Tie: (not visible, ~0%), Others Win: 86.8%
**Panel 2: vs. Kimi-K2**
* **Presentation:** Ours Win: 37.1%, Tie: 3.6%, Others Win: 59.3%
* **Reasoning:** Ours Win: 47.4%, Tie: 4.1%, Others Win: 48.5%
* **Summarization:** Ours Win: 42.8%, Tie: (not visible, ~0%), Others Win: 54.9%
* **Overall:** Ours Win: 42.7%, Tie: (not visible, ~0%), Others Win: 56.4%
**Panel 3: vs. MiniMax-M2**
* **Presentation:** Ours Win: 35.9%, Tie: 4.1%, Others Win: 60.0%
* **Reasoning:** Ours Win: 40.8%, Tie: 5.4%, Others Win: 53.8%
* **Summarization:** Ours Win: 25.3%, Tie: (not visible, ~0%), Others Win: 71.8%
* **Overall:** Ours Win: 31.7%, Tie: (not visible, ~0%), Others Win: 67.5%
**Panel 4: vs. Qwen-Plus-Latest**
* **Presentation:** Ours Win: 52.1%, Tie: 5.3%, Others Win: 42.6%
* **Reasoning:** Ours Win: 35.1%, Tie: 7.4%, Others Win: 57.5%
* **Summarization:** Ours Win: 76.3%, Tie: 3.6%, Others Win: 20.1%
* **Overall:** Ours Win: 58.8%, Tie: (not visible, ~0%), Others Win: 40.3%
**Panel 5: vs. Qwen3-30B-A3B-Thinking-2507**
* **Presentation:** Ours Win: 73.7%, Tie: 4.4%, Others Win: 21.9%
* **Reasoning:** Ours Win: 56.8%, Tie: 6.0%, Others Win: 37.2%
* **Summarization:** Ours Win: 81.9%, Tie: 4.8%, Others Win: 13.3%
* **Overall:** Ours Win: 77.5%, Tie: (not visible, ~0%), Others Win: 21.6%
### Key Observations
1. **Performance Gradient:** There is a clear gradient in "Ours" model performance across the competitors. It performs most poorly against Gemini-3-Pro (Overall: 12.4% win rate) and most strongly against Qwen3-30B-A3B-Thinking-2507 (Overall: 77.5% win rate).
2. **Task-Specific Strengths:** The "Ours" model shows a particularly strong performance in the **Summarization** task against the Qwen-based models (76.3% and 81.9% win rates).
3. **Low Tie Rates:** The "Tie" category (light blue) is consistently the smallest segment, often below 7%, indicating that evaluations typically result in a clear win for one model or the other.
4. **Consistent Losses vs. Gemini:** Against Gemini-3-Pro, "Ours" loses in the vast majority of comparisons across all tasks, with win rates never exceeding 15.6%.
### Interpretation
This chart presents a benchmark evaluation, likely from a technical report or model card, demonstrating the relative strengths of the "Ours" model. The data suggests that the "Ours" model is not universally superior but has a competitive profile that varies significantly by opponent and task.
* **Competitive Landscape:** The model appears to be positioned as a strong competitor to the Qwen series of models, especially in summarization tasks, while being outperformed by Gemini-3-Pro in this specific evaluation setup.
* **Task Specialization:** The high win rates in Summarization against certain models could indicate a architectural or training data advantage in that specific capability.
* **Purpose of Visualization:** The chart effectively communicates that model performance is not monolithic. It provides a nuanced view for technical audiences to understand where the "Ours" model excels and where it may require further development, aiding in informed model selection for specific use cases. The near-absence of ties suggests the evaluation methodology produces decisive results.