## Bar Chart: Model Performance Comparison Across Evaluation Criteria
### Overview
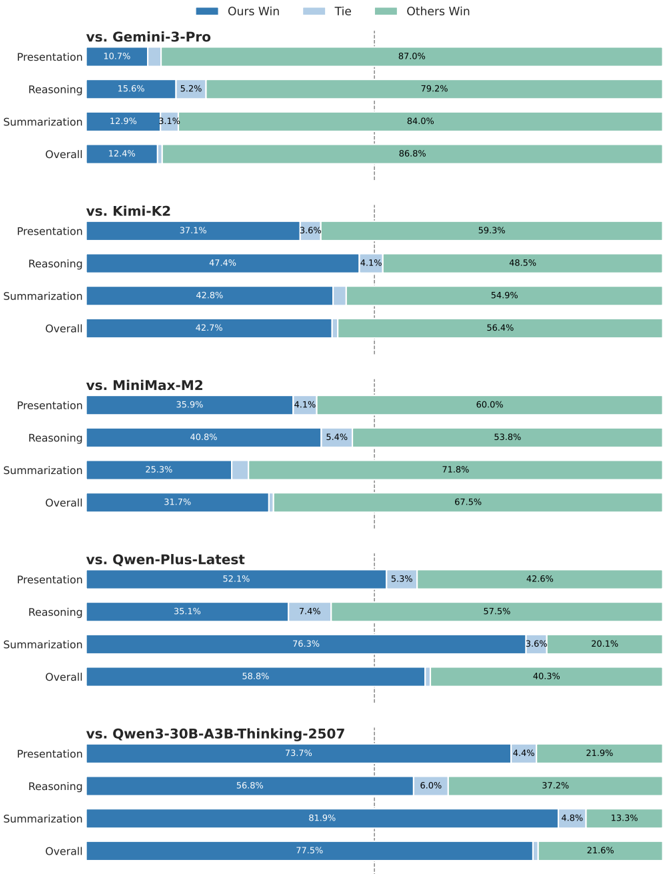
The chart compares the performance of a reference model ("Ours") against five other models (Gemini-3-Pro, Kimi-K2, MiniMax-M2, Qwen-Plus-Latest, Qwen3-30B-A3BB-Thinking-2507) across four evaluation criteria: Presentation, Reasoning, Summarization, and Overall. Results are segmented into three categories: "Ours Win" (blue), "Tie" (light blue), and "Others Win" (green), with percentages displayed for each segment.
### Components/Axes
- **X-Axis**: Evaluation criteria (Presentation, Reasoning, Summarization, Overall) for each model comparison.
- **Y-Axis**: Models being compared (Gemini-3-Pro, Kimi-K2, MiniMax-M2, Qwen-Plus-Latest, Qwen3-30B-A3BB-Thinking-2507), listed vertically.
- **Legend**:
- Blue = "Ours Win"
- Light Blue = "Tie"
- Green = "Others Win"
- **Data Format**: Stacked horizontal bars with percentage labels for each segment.
### Detailed Analysis
#### vs. Gemini-3-Pro
- **Presentation**: 10.7% (Ours Win), 5.2% (Tie), 87.0% (Others Win)
- **Reasoning**: 15.6% (Ours Win), 5.2% (Tie), 79.2% (Others Win)
- **Summarization**: 12.9% (Ours Win), 3.1% (Tie), 84.0% (Others Win)
- **Overall**: 12.4% (Ours Win), 1.0% (Tie), 86.8% (Others Win)
#### vs. Kimi-K2
- **Presentation**: 37.1% (Ours Win), 3.6% (Tie), 59.3% (Others Win)
- **Reasoning**: 47.4% (Ours Win), 4.1% (Tie), 48.5% (Others Win)
- **Summarization**: 42.8% (Ours Win), 1.0% (Tie), 54.9% (Others Win)
- **Overall**: 42.7% (Ours Win), 1.0% (Tie), 56.4% (Others Win)
#### vs. MiniMax-M2
- **Presentation**: 35.9% (Ours Win), 4.1% (Tie), 60.0% (Others Win)
- **Reasoning**: 40.8% (Ours Win), 5.4% (Tie), 53.8% (Others Win)
- **Summarization**: 25.3% (Ours Win), 1.0% (Tie), 71.8% (Others Win)
- **Overall**: 31.7% (Ours Win), 1.0% (Tie), 67.5% (Others Win)
#### vs. Qwen-Plus-Latest
- **Presentation**: 52.1% (Ours Win), 5.3% (Tie), 42.6% (Others Win)
- **Reasoning**: 35.1% (Ours Win), 7.4% (Tie), 57.5% (Others Win)
- **Summarization**: 76.3% (Ours Win), 3.6% (Tie), 20.1% (Others Win)
- **Overall**: 58.8% (Ours Win), 1.0% (Tie), 40.3% (Others Win)
#### vs. Qwen3-30B-A3BB-Thinking-2507
- **Presentation**: 73.7% (Ours Win), 4.4% (Tie), 21.9% (Others Win)
- **Reasoning**: 56.8% (Ours Win), 6.0% (Tie), 37.2% (Others Win)
- **Summarization**: 81.9% (Ours Win), 4.8% (Tie), 13.3% (Others Win)
- **Overall**: 77.5% (Ours Win), 1.0% (Tie), 21.6% (Others Win)
### Key Observations
1. **Performance Trends**:
- "Ours Win" percentages increase significantly against weaker models (e.g., Qwen-Plus-Latest: 58.8% Overall vs. 40.3% Others Win).
- Against stronger models (e.g., Gemini-3-Pro), "Ours Win" remains low (12.4% Overall), with "Others Win" dominating (86.8%).
- "Tie" percentages are consistently low (<5%) across all comparisons, except in Reasoning vs. Gemini-3-Pro (5.2%).
2. **Category-Specific Insights**:
- **Reasoning**: Highest "Ours Win" against Qwen3-30B-A3BB-Thinking-2507 (56.8%).
- **Summarization**: Strongest performance against Qwen-Plus-Latest (76.3% Ours Win).
- **Presentation**: Weakest performance against Gemini-3-Pro (10.7% Ours Win).
3. **Anomalies**:
- "Others Win" dominates in most comparisons, suggesting the reference model often underperforms relative to other competitors.
- Qwen3-30B-A3BB-Thinking-2507 shows the most favorable results for "Ours Win" across all categories.
### Interpretation
The data indicates that the reference model ("Ours") performs best in **Reasoning** and **Summarization** against weaker models like Qwen-Plus-Latest and Qwen3-30B-A3BB-Thinking-2507. However, it struggles in **Presentation** against stronger models like Gemini-3-Pro. The high "Others Win" percentages across comparisons suggest that in many cases, neither the reference model nor the compared model is the top performer, possibly due to the presence of unlisted competitors or contextual factors. The model's overall effectiveness improves as the strength of the compared model decreases, highlighting its relative advantages in specific evaluation criteria.