\n
## Diagram: ZIPn Decomposition
### Overview
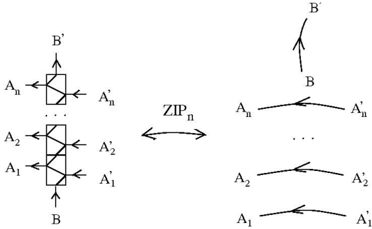
The image depicts a diagram illustrating the decomposition of a structure labeled "ZIPn" into its constituent parts. The diagram shows a central block with internal connections, and arrows indicating the separation of this block into individual components and their corresponding counterparts. The diagram appears to be a visual representation of a process or algorithm, likely related to data compression or encoding.
### Components/Axes
The diagram consists of the following labeled components:
* **ZIPn**: A central block representing the overall structure.
* **A1, A2, ..., An**: Input components entering the central block.
* **A'1, A'2, ..., A'n**: Output components exiting the central block.
* **B**: Input component entering the central block from the top.
* **B'**: Output component exiting the central block from the top.
* Arrows: Indicate the flow and decomposition process.
### Detailed Analysis or Content Details
The diagram can be divided into two main sections: the central block and the decomposed components.
**Central Block (Left Side):**
The central block is a rectangular shape with internal connections represented by lines. It has two sets of input arrows (A1 to An) entering from the left and two sets of output arrows (A'1 to A'n) exiting from the right. Additionally, there is an input arrow B entering from the top and an output arrow B' exiting from the top. The internal structure of the block is not detailed, but it suggests a transformation or processing of the input components.
**Decomposed Components (Right Side):**
The right side of the diagram shows the decomposed components. Each input-output pair (Ai, A'i) and (B, B') is represented by a short line with arrows at both ends. This suggests a direct mapping or relationship between the input and output components. The ellipsis (...) indicates that there are multiple such pairs between A1 and An. The arrows indicate a flow or transformation from Ai to A'i and from B to B'.
The double-headed arrow between the central block and the decomposed components indicates a reversible process or a decomposition/reconstruction relationship.
### Key Observations
* The diagram illustrates a decomposition process where a complex structure (ZIPn) is broken down into simpler components.
* The input and output components are paired, suggesting a transformation or mapping between them.
* The diagram is abstract and does not provide specific numerical values or quantitative data.
* The use of primes (e.g., A'1) suggests a modified or transformed version of the original component (A1).
### Interpretation
The diagram likely represents a conceptual model of a data compression or encoding algorithm, where "ZIPn" represents the compressed or encoded data. The decomposition process shows how the compressed data can be broken down into its original components (A1 to An and B). The arrows indicate the flow of information during the compression and decompression processes.
The diagram suggests that the algorithm involves a transformation of the input components (Ai) into their corresponding output components (A'i), and a similar transformation for the component B into B'. The reversible nature of the process (indicated by the double-headed arrow) implies that the algorithm is lossless, meaning that the original data can be perfectly reconstructed from the compressed data.
The diagram is a high-level representation and does not provide details about the specific algorithms or techniques used for compression or encoding. It serves as a visual aid for understanding the overall structure and flow of the process. The diagram is not providing facts or data, but rather a conceptual illustration.