## Bar Chart: Model Performance Comparison
### Overview
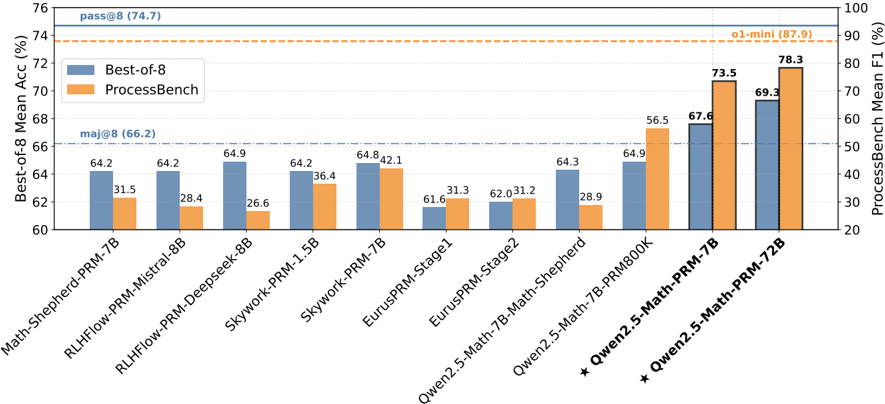
The image is a bar chart comparing the performance of various language models on two metrics: "Best-of-8 Mean Accuracy (%)" and "ProcessBench Mean F1 (%)". The chart displays the performance of different models, with blue bars representing the "Best-of-8" accuracy and orange bars representing the "ProcessBench" F1 score. The x-axis lists the models, and the y-axes show the corresponding percentage scores. Horizontal lines indicate baseline performance levels.
### Components/Axes
* **Title:** None explicit in the image.
* **X-axis:** Model Names (see list below)
* **Left Y-axis:** "Best-of-8 Mean Acc (%)", ranging from 60 to 76.
* **Right Y-axis:** "ProcessBench Mean F1 (%)", ranging from 20 to 100.
* **Legend:**
* Blue: "Best-of-8"
* Orange: "ProcessBench"
* **Horizontal Lines:**
* Solid Blue: "pass@8 (74.7)"
* Dashed Orange: "o1-mini (87.9)"
* Dashed-dotted Blue: "maj@8 (66.2)"
* **X-axis Labels (Models):**
* Math-Shepherd-PRM-7B
* RLHFlow-PRM-Mistral-8B
* RLHFlow-PRM-Deepseek-8B
* Skywork-PRM-1.5B
* Skywork-PRM-7B
* EurusPRM-Stage1
* EurusPRM-Stage2
* Qwen2.5-Math-7B-Math-Shepherd
* Qwen2.5-Math-7B-PRM800K
* \* Qwen2.5-Math-PRM-7B
* \* Qwen2.5-Math-PRM-72B
### Detailed Analysis
Here's a breakdown of the data for each model, including the "Best-of-8" accuracy (blue bars) and "ProcessBench" F1 score (orange bars):
* **Math-Shepherd-PRM-7B:**
* Best-of-8: 64.2%
* ProcessBench: 31.5%
* **RLHFlow-PRM-Mistral-8B:**
* Best-of-8: 64.2%
* ProcessBench: 28.4%
* **RLHFlow-PRM-Deepseek-8B:**
* Best-of-8: 64.9%
* ProcessBench: 26.6%
* **Skywork-PRM-1.5B:**
* Best-of-8: 64.2%
* ProcessBench: 36.4%
* **Skywork-PRM-7B:**
* Best-of-8: 64.8%
* ProcessBench: 42.1%
* **EurusPRM-Stage1:**
* Best-of-8: 61.6%
* ProcessBench: 31.3%
* **EurusPRM-Stage2:**
* Best-of-8: 62.0%
* ProcessBench: 31.2%
* **Qwen2.5-Math-7B-Math-Shepherd:**
* Best-of-8: 64.3%
* ProcessBench: 28.9%
* **Qwen2.5-Math-7B-PRM800K:**
* Best-of-8: 64.9%
* ProcessBench: 56.5%
* **\* Qwen2.5-Math-PRM-7B:**
* Best-of-8: 67.6%
* ProcessBench: 73.5%
* **\* Qwen2.5-Math-PRM-72B:**
* Best-of-8: 69.3%
* ProcessBench: 78.3%
### Key Observations
* The models "Qwen2.5-Math-PRM-7B" and "Qwen2.5-Math-PRM-72B" (marked with asterisks) show significantly higher "ProcessBench" F1 scores compared to the other models.
* The "Best-of-8" accuracy scores are relatively consistent across most models, hovering around the mid-60s percentage range.
* The "ProcessBench" F1 scores vary more widely, indicating differences in how well the models perform on the "ProcessBench" task.
* The horizontal lines provide context for the scores, indicating target performance levels ("pass@8", "o1-mini", "maj@8").
### Interpretation
The chart suggests that while most models achieve similar "Best-of-8" accuracies, their performance on the "ProcessBench" task varies considerably. The Qwen2.5 models, particularly the 72B variant, demonstrate superior performance on the "ProcessBench" metric. This could indicate that these models are better suited for the specific tasks or data used in the "ProcessBench" evaluation. The horizontal lines act as benchmarks, showing which models meet or exceed certain performance thresholds. The models marked with asterisks are the top performers.