## Bar Chart: Model Performance Comparison
### Overview
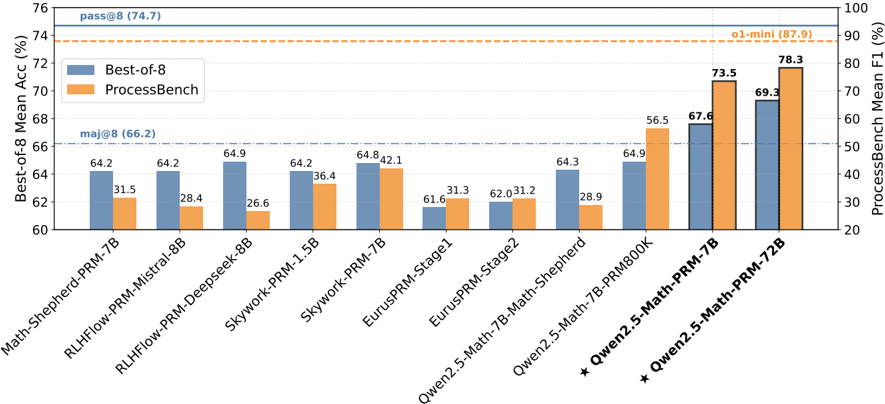
This bar chart compares the performance of several language models on two benchmarks: Best-of-8 Mean Accuracy (%) and ProcessBench Mean F1 (%). The models are listed along the x-axis, and their performance scores are represented by the height of the bars. There are two dashed horizontal lines indicating overall performance thresholds for each benchmark.
### Components/Axes
* **X-axis:** Model Names: Math-Shepherd-PRM-7B, RLHFlow-PRM-Mistral-8B, Skywork-PRM-Deepseek-8B, Skywork-PRM-1.5B, Skywork-PRM-7B, EurusPRM-Stage1, EurusPRM-Stage2, Owen2.5-Math-7B-Math-Shepherd, Owen2.5-Math-7B-PRM800K, Owen2.5-Math-PRM-7B, Owen2.5-Math-PRM-72B.
* **Y-axis (Left):** Best-of-8 Mean Acc (%) - Scale ranges from approximately 60% to 76%.
* **Y-axis (Right):** ProcessBench Mean F1 (%) - Scale ranges from approximately 20% to 100%.
* **Legend:**
* Blue: Best-of-8
* Orange: ProcessBench
* **Horizontal Dashed Lines:**
* pass@8 (74.7) - corresponds to Best-of-8 Mean Accuracy
* ol-mini (87.9) - corresponds to ProcessBench Mean F1
* maj@8 (66.2) - corresponds to Best-of-8 Mean Accuracy
### Detailed Analysis
The chart displays bar pairs for each model, representing their Best-of-8 accuracy and ProcessBench F1 score.
* **Math-Shepherd-PRM-7B:** Best-of-8: 64.2%, ProcessBench: 31.5%
* **RLHFlow-PRM-Mistral-8B:** Best-of-8: 64.2%, ProcessBench: 28.4%
* **Skywork-PRM-Deepseek-8B:** Best-of-8: 64.9%, ProcessBench: 26.6%
* **Skywork-PRM-1.5B:** Best-of-8: 64.2%, ProcessBench: 36.4%
* **Skywork-PRM-7B:** Best-of-8: 64.8%, ProcessBench: 42.1%
* **EurusPRM-Stage1:** Best-of-8: 61.6%, ProcessBench: 31.3%
* **EurusPRM-Stage2:** Best-of-8: 62.0%, ProcessBench: 31.2%
* **Owen2.5-Math-7B-Math-Shepherd:** Best-of-8: 64.3%, ProcessBench: 28.9%
* **Owen2.5-Math-7B-PRM800K:** Best-of-8: 64.9%, ProcessBench: 56.5%
* **Owen2.5-Math-PRM-7B:** Best-of-8: 73.5%, ProcessBench: 67.6%
* **Owen2.5-Math-PRM-72B:** Best-of-8: 78.3%, ProcessBench: 70.3%
**Trends:**
* Generally, models with higher Best-of-8 accuracy do *not* necessarily have higher ProcessBench F1 scores.
* The Owen2.5-Math-PRM-7B and Owen2.5-Math-PRM-72B models show significantly higher Best-of-8 accuracy compared to the other models.
* The Owen2.5-Math-PRM-72B model has the highest overall performance on both benchmarks.
### Key Observations
* The Owen2.5-Math-PRM-72B model clearly outperforms all others on both metrics.
* There's a wide range of performance on the ProcessBench benchmark, suggesting varying capabilities in the models' ability to handle that specific task.
* The Skywork-PRM-Deepseek-8B model has a relatively high Best-of-8 accuracy but a low ProcessBench F1 score.
* The models Math-Shepherd-PRM-7B, RLHFlow-PRM-Mistral-8B, and Skywork-PRM-1.5B have similar Best-of-8 accuracy scores.
### Interpretation
The chart demonstrates the performance trade-offs between different language models on two distinct benchmarks. Best-of-8 appears to measure a more general accuracy, while ProcessBench focuses on a specific type of reasoning or task. The Owen2.5-Math-PRM-72B model stands out as a strong performer across both benchmarks, indicating a well-rounded capability. The discrepancies between Best-of-8 and ProcessBench scores for certain models (e.g., Skywork-PRM-Deepseek-8B) suggest that model architecture or training data may be optimized for one type of task over the other. The horizontal lines (pass@8, ol-mini, maj@8) provide context for evaluating the models' performance relative to established thresholds. The chart is useful for comparing the strengths and weaknesses of different models and selecting the most appropriate model for a given application. The asterisk (*) next to the last two model names may indicate a special configuration or version.