## Bar Chart: Model Performance Comparison on Best-of-8 Accuracy and ProcessBench F1
### Overview
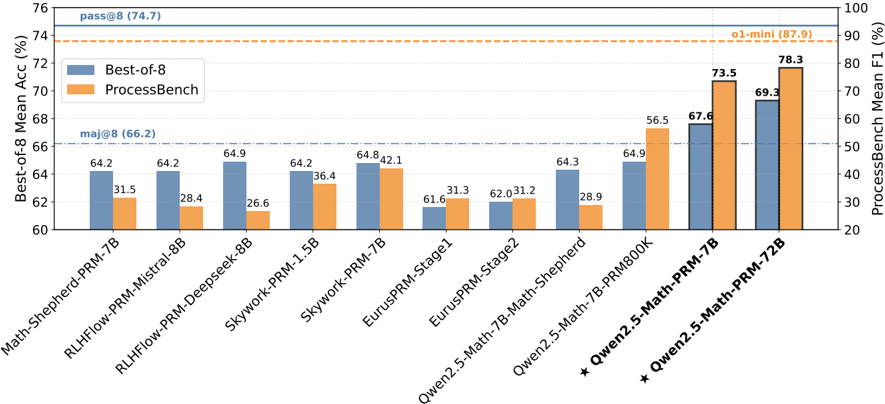
The image is a dual-axis bar chart comparing the performance of 11 different language models on two distinct evaluation metrics: "Best-of-8 Mean Accuracy" (left y-axis, blue bars) and "ProcessBench Mean F1" (right y-axis, orange bars). The chart includes reference lines for baseline performance levels.
### Components/Axes
* **Chart Type:** Grouped bar chart with dual y-axes.
* **X-Axis (Categories):** Lists 11 model names. From left to right:
1. `Math-Shepherd-PRM-7B`
2. `RLHFlow-PRM-Mistral-8B`
3. `RLHFlow-PRM-Deepseek-8B`
4. `Skywork-PRM-1.5B`
5. `Skywork-PRM-7B`
6. `EurusPRM-Stage1`
7. `EurusPRM-Stage2`
8. `Qwen2.5-Math-7B-Math-Shepherd`
9. `Qwen2.5-Math-7B-PRM800K`
10. `★ Qwen2.5-Math-PRM-7B`
11. `★ Qwen2.5-Math-PRM-72B`
* **Left Y-Axis (Primary):** Label: `Best-of-8 Mean Acc (%)`. Scale ranges from 60 to 76, with major ticks every 2 units.
* **Right Y-Axis (Secondary):** Label: `ProcessBench Mean F1 (%)`. Scale ranges from 20 to 100, with major ticks every 10 units.
* **Legend:** Located in the top-left quadrant.
* Blue square: `Best-of-8`
* Orange square: `ProcessBench`
* **Reference Lines:**
* Solid blue horizontal line at ~74.7% on the left axis, labeled `pass@8 (74.7)`.
* Dash-dot blue horizontal line at ~66.2% on the left axis, labeled `maj@8 (66.2)`.
* Dashed orange horizontal line at ~87.9% on the right axis, labeled `o1-mini (87.9)`.
### Detailed Analysis
**Data Series & Values (Model: Best-of-8 (Blue) | ProcessBench (Orange)):**
1. `Math-Shepherd-PRM-7B`: 64.2 | 31.5
2. `RLHFlow-PRM-Mistral-8B`: 64.2 | 28.4
3. `RLHFlow-PRM-Deepseek-8B`: 64.9 | 26.6
4. `Skywork-PRM-1.5B`: 64.2 | 36.4
5. `Skywork-PRM-7B`: 64.8 | 42.1
6. `EurusPRM-Stage1`: 61.6 | 31.3
7. `EurusPRM-Stage2`: 62.0 | 31.2
8. `Qwen2.5-Math-7B-Math-Shepherd`: 64.3 | 28.9
9. `Qwen2.5-Math-7B-PRM800K`: 64.9 | 56.5
10. `★ Qwen2.5-Math-PRM-7B`: 67.6 | 73.5
11. `★ Qwen2.5-Math-PRM-72B`: 69.3 | 78.3
**Trend Verification:**
* **Best-of-8 (Blue Bars):** The trend is generally flat or slightly increasing from left to right, with a notable dip for the `EurusPRM` models. The two `★ Qwen2.5-Math-PRM` models on the far right show a clear upward step.
* **ProcessBench (Orange Bars):** The trend is more variable. It starts low, peaks at `Skywork-PRM-7B`, dips again, then rises sharply for the last three models, culminating in the highest value for `★ Qwen2.5-Math-PRM-72B`.
### Key Observations
1. **Performance Gap:** There is a significant performance gap between the two metrics for most models. Best-of-8 Accuracy scores cluster between 61.6% and 69.3%, while ProcessBench F1 scores vary widely from 26.6% to 78.3%.
2. **Top Performers:** The models marked with a star (`★ Qwen2.5-Math-PRM-7B` and `72B`) are the top performers on both metrics, with the 72B variant achieving the highest scores overall.
3. **Reference Line Context:** No model reaches the `pass@8` (74.7%) or `o1-mini` (87.9%) reference lines. All models exceed the `maj@8` (66.2%) baseline for Best-of-8 Accuracy.
4. **Model Family Trends:** Within the `Qwen2.5-Math` family, performance on ProcessBench improves dramatically with the specialized PRM models (`PRM800K`, `PRM-7B`, `PRM-72B`), while Best-of-8 Accuracy sees a more modest improvement.
5. **Outlier:** `RLHFlow-PRM-Deepseek-8B` has the lowest ProcessBench F1 score (26.6%) despite a competitive Best-of-8 Accuracy (64.9%).
### Interpretation
This chart evaluates Process Reward Models (PRMs) for mathematical reasoning. The two metrics measure different aspects of capability:
* **Best-of-8 Mean Accuracy** likely measures the final answer correctness when sampling 8 reasoning paths and selecting the best one (a common technique for improving LLM outputs).
* **ProcessBench Mean F1** likely evaluates the model's ability to correctly identify the step-by-step quality or correctness of a reasoning process, a more granular task.
The data suggests that while many models achieve similar final answer accuracy (Best-of-8), their ability to understand and evaluate the reasoning *process* (ProcessBench) varies greatly. The superior performance of the `★ Qwen2.5-Math-PRM` models, especially the 72B version, indicates that scaling and specialized training on process supervision data lead to significant gains in process evaluation capability, which is a crucial component for building reliable reasoning systems. The gap between a model's process evaluation skill and its final answer generation skill (e.g., `RLHFlow-PRM-Deepseek-8B`) highlights that these are distinct abilities that do not necessarily improve in tandem. The reference lines (`pass@8`, `o1-mini`) set a high bar that current PRMs have yet to meet, indicating room for improvement in the field.