# Technical Document Analysis: Bar Chart of Model Performance Metrics
## Title
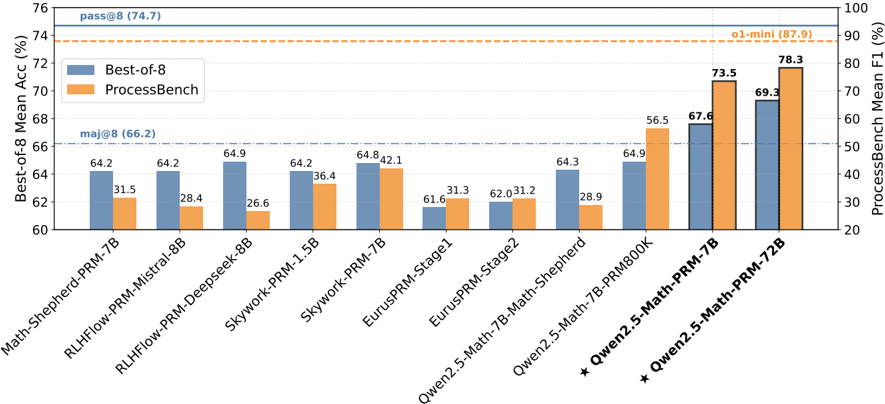
**Best-of-8 Mean Accuracy (%) vs ProcessBench Mean F1 (%)**
---
## Axes and Labels
- **X-Axis**: Model names (categories):
- Math-Shepherd-PRM-7B
- RLFlow-PRM-Mistral-8B
- RLFlow-PRM-Deepseek-8B
- Skywork-PRM-1.5B
- Skywork-PRM-7B
- EurusPRM-Stage1
- EurusPRM-Stage2
- Owen2.5-Math-Shepherd
- Owen2.5-Math-PRM800K
- Owen2.5-Math-PRM-7B
- Owen2.5-Math-PRM-72B
- **Y-Axis (Left)**: **Best-of-8 Mean Accuracy (%)** (blue bars)
- **Y-Axis (Right)**: **ProcessBench Mean F1 (%)** (orange bars)
- **Dashed Lines**:
- **pass@8 (74.7%)**: Horizontal dashed line at 74.7% (left Y-axis)
- **maj@8 (66.2%)**: Horizontal dashed line at 66.2% (left Y-axis)
---
## Legend
- **Location**: Right side of the chart
- **Colors**:
- **Blue**: Best-of-8 Mean Accuracy (%)
- **Orange**: ProcessBench Mean F1 (%)
---
## Data Points and Trends
### Best-of-8 Mean Accuracy (%)
- **Range**: 61.6% (EurusPRM-Stage1) to 69.3% (Owen2.5-Math-PRM-72B)
- **Key Observations**:
- **Highest**: Owen2.5-Math-PRM-72B (69.3%)
- **Lowest**: EurusPRM-Stage1 (61.6%)
- **Thresholds**:
- **maj@8 (66.2%)**: Exceeded by 7 models (e.g., Math-Shepherd-PRM-7B: 64.2%, RLFlow-PRM-Deepseek-8B: 64.9%, Skywork-PRM-7B: 64.8%, Owen2.5-Math-Shepherd: 64.3%, Owen2.5-Math-PRM800K: 64.9%, Owen2.5-Math-PRM-7B: 67.6%, Owen2.5-Math-PRM-72B: 69.3%)
- **pass@8 (74.7%)**: None of the Best-of-8 models reach this threshold.
### ProcessBench Mean F1 (%)
- **Range**: 26.6% (RLFlow-PRM-Deepseek-8B) to 78.3% (Owen2.5-Math-PRM-72B)
- **Key Observations**:
- **Highest**: Owen2.5-Math-PRM-72B (78.3%)
- **Lowest**: RLFlow-PRM-Deepseek-8B (26.6%)
- **Thresholds**:
- **pass@8 (74.7%)**: Exceeded by 2 models (Owen2.5-Math-PRM-7B: 73.5%, Owen2.5-Math-PRM-72B: 78.3%)
- **maj@8 (66.2%)**: Exceeded by 5 models (Owen2.5-Math-Shepherd: 56.5%, Owen2.5-Math-PRM800K: 64.9%, Owen2.5-Math-PRM-7B: 67.6%, Owen2.5-Math-PRM-72B: 78.3%)
---
## Additional Notes
- **Stars (★)**: Indicate top-performing models in **ProcessBench Mean F1 (%)**:
- **★ Owen2.5-Math-PRM-7B** (73.5%)
- **★ Owen2.5-Math-PRM-72B** (78.3%)
- **Color Consistency**:
- Blue bars (Best-of-8) and orange bars (ProcessBench) align with the legend.
- No mismatches detected between legend labels and bar colors.
---
## Summary
The chart compares **Best-of-8 Mean Accuracy (%)** and **ProcessBench Mean F1 (%)** across 11 models. While Best-of-8 accuracy remains below the **pass@8 (74.7%)** threshold, ProcessBench F1 scores show significant variation, with the top models (Owen2.5-Math-PRM-7B and Owen2.5-Math-PRM-72B) exceeding both **pass@8** and **maj@8** thresholds. The stars highlight the highest-performing models in ProcessBench.