\n
## Pie Chart: Token Distribution for SFT
### Overview
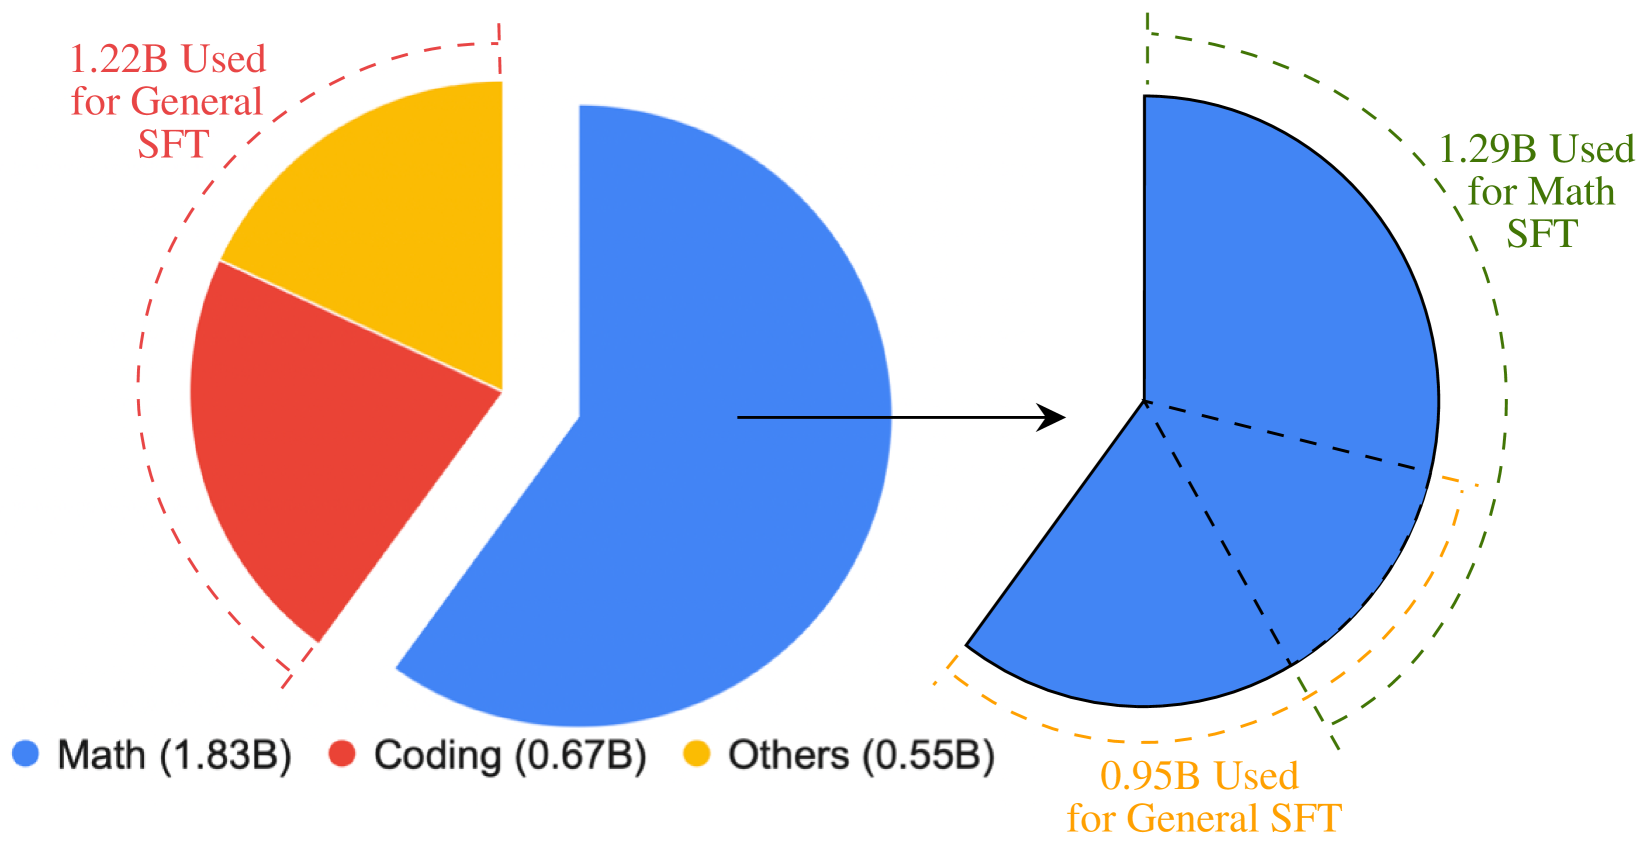
The image presents two pie charts illustrating the distribution of tokens used for Supervised Fine-Tuning (SFT). The first pie chart shows the overall distribution across Math, Coding, and Other categories. The second pie chart focuses on the breakdown of tokens used specifically for Math SFT, showing the proportion allocated to General SFT and Math SFT. An arrow connects the two charts, indicating a relationship between the overall token distribution and the Math SFT allocation.
### Components/Axes
* **Pie Chart 1 (Left):** Represents the total token distribution.
* Categories: Math, Coding, Others
* Values: 1.83B, 0.67B, 0.55B respectively.
* **Pie Chart 2 (Right):** Represents the token distribution within Math SFT.
* Categories: General SFT, Math SFT
* Values: 0.95B, 1.29B respectively.
* **Legend (Bottom-Left):**
* Blue: Math (1.83B)
* Red: Coding (0.67B)
* Yellow: Others (0.55B)
* **Annotations:**
* "1.22B Used for General SFT" (Top-Right of Pie Chart 1)
* "1.29B Used for Math SFT" (Top-Right of Pie Chart 2)
* "0.95B Used for General SFT" (Bottom-Right of Pie Chart 2)
* **Arrow:** Connects Pie Chart 1 to Pie Chart 2, indicating a flow or relationship.
### Detailed Analysis
**Pie Chart 1:**
* The largest segment, colored blue, represents Math tokens, accounting for 1.83 billion tokens. This segment occupies approximately 45% of the pie chart.
* The second largest segment, colored red, represents Coding tokens, accounting for 0.67 billion tokens. This segment occupies approximately 16% of the pie chart.
* The smallest segment, colored yellow, represents Other tokens, accounting for 0.55 billion tokens. This segment occupies approximately 13% of the pie chart.
**Pie Chart 2:**
* The larger segment, colored blue, represents Math SFT tokens, accounting for 1.29 billion tokens. This segment occupies approximately 60% of the pie chart.
* The smaller segment, colored yellow, represents General SFT tokens, accounting for 0.95 billion tokens. This segment occupies approximately 40% of the pie chart.
### Key Observations
* Math tokens constitute the largest portion of the overall token distribution (45%).
* Within Math SFT, the majority of tokens are dedicated to Math SFT itself (60%), while a significant portion is also used for General SFT (40%).
* The annotation "1.22B Used for General SFT" on the first pie chart seems to be a mislabel, as the total tokens used for General SFT (from the second pie chart) is 0.95B.
* The arrow suggests that a portion of the overall Math tokens (1.83B) is allocated to Math SFT (1.29B) and General SFT (0.95B).
### Interpretation
The data suggests a strong focus on Math in the SFT process, with Math tokens representing the largest share of the overall distribution. The breakdown within Math SFT indicates a balanced approach, dedicating a substantial amount of tokens to both Math-specific and general SFT tasks. The annotation discrepancy suggests a potential error in labeling or data reporting. The relationship between the two charts highlights how the overall token distribution influences the allocation of resources within specific SFT domains like Math. The data implies that the model is being trained with a significant emphasis on mathematical capabilities, and that this training is being done in a way that leverages both specialized and general knowledge.