\n
## Pie Chart with Segment Breakdown: Data Allocation for Supervised Fine-Tuning (SFT)
### Overview
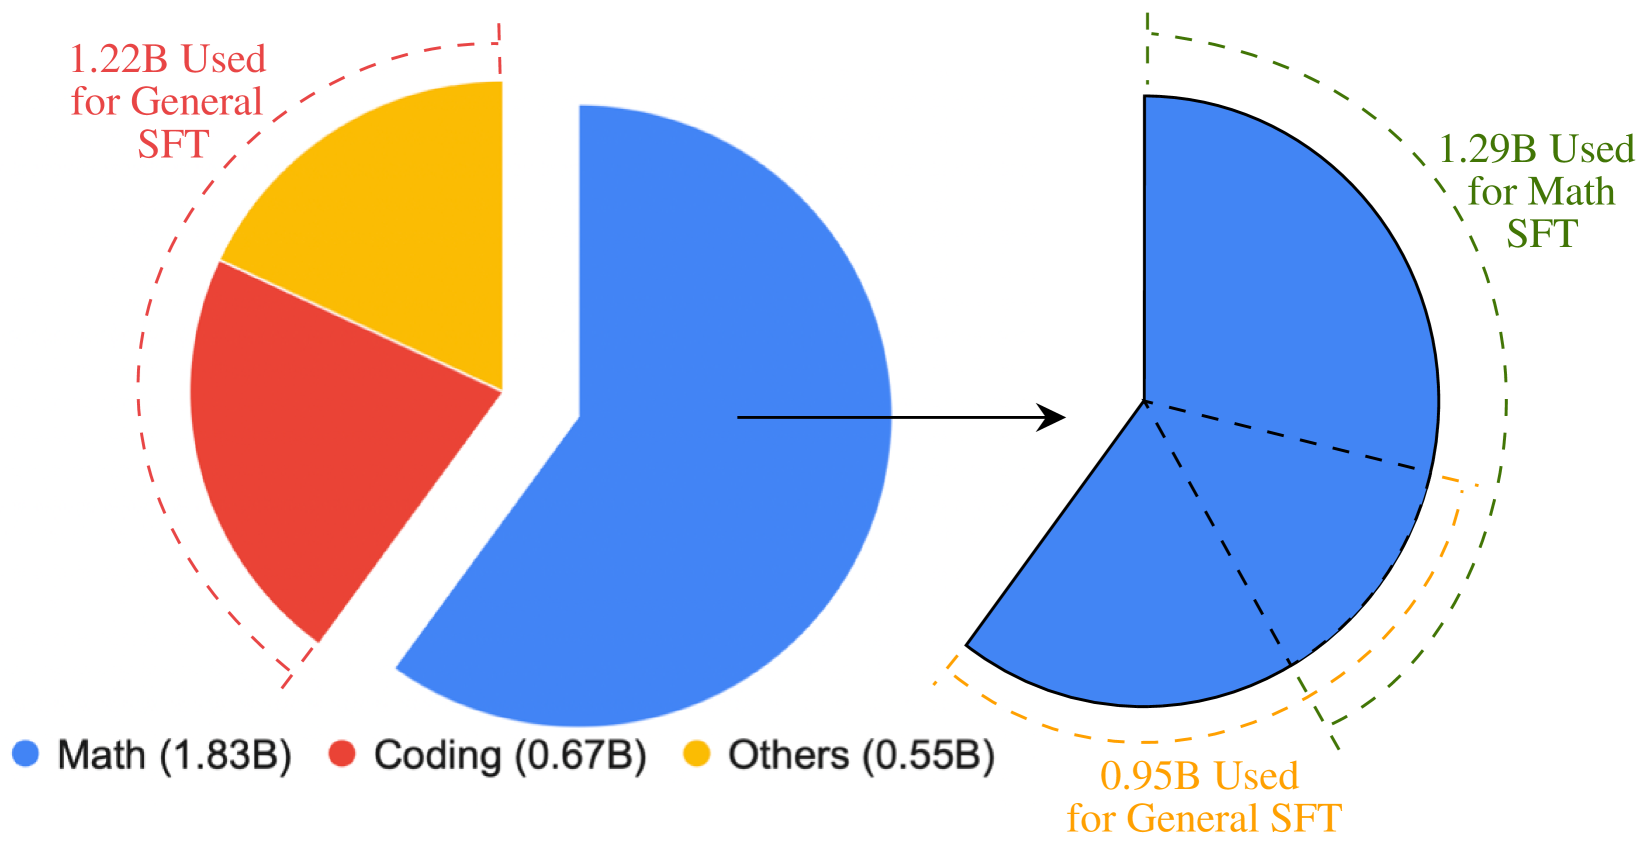
The image displays a two-part pie chart visualization illustrating the allocation of a large dataset (measured in billions, denoted by "B") for different types of Supervised Fine-Tuning (SFT). The primary chart on the left shows the overall distribution across three broad categories. A specific segment from this primary chart is then exploded and further broken down into two sub-categories in a secondary chart on the right, connected by a black arrow.
### Components/Axes
* **Primary Pie Chart (Left):**
* **Segments & Legend (Bottom-Left):**
* **Blue Segment:** Labeled "Math (1.83B)" in the legend. This is the largest segment, occupying more than half of the pie.
* **Red Segment:** Labeled "Coding (0.67B)" in the legend.
* **Yellow Segment:** Labeled "Others (0.55B)" in the legend.
* **Annotation (Top-Left):** A red dashed line brackets the red and yellow segments. The associated text reads: "1.22B Used for General SFT". This indicates the combined value of the Coding and Others categories.
* **Secondary Pie Chart (Right):**
* **Source:** This chart is an exploded view of the blue "Math" segment from the primary chart, as indicated by the black arrow.
* **Segments:** The entire secondary chart is blue, representing the original 1.83B Math data. It is divided by dashed black lines into two sub-sections.
* **Annotations:**
* **Top (Green Text & Dashed Line):** "1.29B Used for Math SFT". This label corresponds to the larger sub-section of the blue segment.
* **Bottom (Orange Text & Dashed Line):** "0.95B Used for General SFT". This label corresponds to the smaller sub-section of the blue segment.
### Detailed Analysis
1. **Primary Data Allocation:**
* The total dataset represented in the primary chart sums to 3.05B (1.83B + 0.67B + 0.55B).
* The "Math" category (1.83B) constitutes the majority, approximately 60% of the total.
* The "Coding" (0.67B) and "Others" (0.55B) categories are combined under the annotation "1.22B Used for General SFT". This sum (0.67B + 0.55B = 1.22B) is exact.
2. **Secondary Breakdown of the "Math" Segment:**
* The 1.83B "Math" data is allocated to two SFT purposes:
* **Math SFT:** 1.29B (approximately 70.5% of the Math segment).
* **General SFT:** 0.95B (approximately 51.9% of the Math segment).
* **Critical Data Discrepancy:** The sum of the sub-allocations (1.29B + 0.95B = 2.24B) **exceeds** the original Math segment value of 1.83B by 0.41B. This is a significant numerical inconsistency within the chart's presented data.
### Key Observations
* **Dominance of Math Data:** The "Math" category is the largest single source of training data.
* **Dual Use of Math Data:** A substantial portion of the "Math" data (0.95B) is repurposed for "General SFT," not just math-specific tasks.
* **Clear Grouping for General SFT:** The "Coding" and "Others" categories are explicitly grouped together as contributing to "General SFT."
* **Visual vs. Numerical Inconsistency:** While the visual breakdown of the blue segment into two parts is clear, the annotated numerical values (1.29B and 0.95B) do not arithmetically reconcile with the parent segment's value (1.83B). This suggests a potential error in the chart's data labels or a non-additive relationship not explained in the graphic.
### Interpretation
This chart demonstrates a strategic allocation of training data for fine-tuning AI models, with a strong emphasis on mathematical data. The key insight is that data categorized as "Math" serves a dual purpose: it is used both for specialized "Math SFT" and, significantly, for broader "General SFT." This implies that mathematical reasoning data is considered valuable for improving general model capabilities, not just for solving math problems.
The grouping of "Coding" and "Others" under "General SFT" suggests these domains are viewed as contributors to general knowledge and reasoning, similar to the portion of math data used for the same purpose.
The most notable anomaly is the arithmetic inconsistency in the breakdown of the Math segment. For the chart to be accurate, the values for "Math SFT" and "General SFT" should sum to 1.83B. The current labels (1.29B + 0.95B = 2.24B) indicate either a typo in the numbers, a misunderstanding of the units, or that the sub-allocations are not mutually exclusive parts of the whole. Without additional context, this discrepancy undermines the precise quantitative message of the visualization, though the qualitative trend—that Math data is split between two SFT types—remains clear.