## Line Chart: HellaSwag Performance vs. Tokens Trained
### Overview
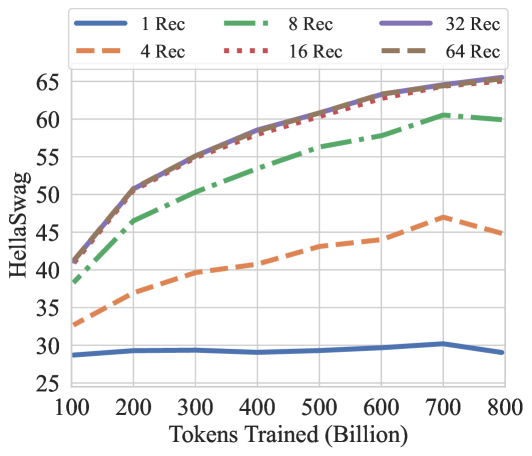
The image is a line chart comparing the performance of different models, measured by HellaSwag score, against the number of tokens trained (in billions). The chart includes six data series, each representing a different model configuration (1 Rec, 4 Rec, 8 Rec, 16 Rec, 32 Rec, and 64 Rec). The chart shows how the HellaSwag score changes as the number of tokens trained increases.
### Components/Axes
* **X-axis:** Tokens Trained (Billion). The scale ranges from 100 to 800, with tick marks at intervals of 100.
* **Y-axis:** HellaSwag. The scale ranges from 25 to 65, with tick marks at intervals of 5.
* **Legend:** Located at the top of the chart, the legend identifies each line by its corresponding model configuration:
* Blue line: 1 Rec
* Orange dashed line: 4 Rec
* Green dash-dot line: 8 Rec
* Red dotted line: 16 Rec
* Purple line: 32 Rec
* Brown dashed line: 64 Rec
### Detailed Analysis
* **1 Rec (Blue Line):** This line remains relatively flat, indicating minimal improvement in HellaSwag score as the number of tokens trained increases. The score fluctuates between approximately 28 and 30.
* At 100 Tokens Trained: ~29
* At 800 Tokens Trained: ~29
* **4 Rec (Orange Dashed Line):** This line shows a moderate increase in HellaSwag score as the number of tokens trained increases. The score starts around 32 and plateaus around 45.
* At 100 Tokens Trained: ~32
* At 800 Tokens Trained: ~45
* **8 Rec (Green Dash-Dot Line):** This line shows a significant increase in HellaSwag score initially, then plateaus as the number of tokens trained increases.
* At 100 Tokens Trained: ~40
* At 800 Tokens Trained: ~58
* **16 Rec (Red Dotted Line):** This line shows a rapid increase in HellaSwag score initially, then plateaus as the number of tokens trained increases.
* At 100 Tokens Trained: ~42
* At 800 Tokens Trained: ~64
* **32 Rec (Purple Line):** This line shows a rapid increase in HellaSwag score initially, then plateaus as the number of tokens trained increases.
* At 100 Tokens Trained: ~42
* At 800 Tokens Trained: ~65
* **64 Rec (Brown Dashed Line):** This line shows a rapid increase in HellaSwag score initially, then plateaus as the number of tokens trained increases.
* At 100 Tokens Trained: ~42
* At 800 Tokens Trained: ~64
### Key Observations
* The 1 Rec model shows almost no improvement with increased training tokens.
* The 4 Rec model shows a moderate improvement, but plateaus at a lower HellaSwag score compared to the other models.
* The 8 Rec, 16 Rec, 32 Rec, and 64 Rec models show significant initial improvements, but their performance plateaus as the number of tokens trained increases.
* The 32 Rec model appears to achieve the highest HellaSwag score, closely followed by the 16 Rec and 64 Rec models.
### Interpretation
The data suggests that increasing the number of Rec (likely referring to recurrent layers or some similar architectural component) significantly improves the model's performance, as measured by the HellaSwag score, up to a certain point. The 1 Rec model's flat line indicates that it is likely under-parameterized and cannot effectively learn from the training data, regardless of the number of tokens trained. The other models (4 Rec, 8 Rec, 16 Rec, 32 Rec, and 64 Rec) benefit from increased training, but their performance plateaus, suggesting diminishing returns. The 32 Rec model appears to be the most effective configuration, achieving the highest HellaSwag score. The similarity in performance between 16 Rec, 32 Rec, and 64 Rec models at higher training token counts suggests that there may be a saturation point beyond which adding more Rec does not significantly improve performance.