\n
## Line Chart: HellaSwag Performance vs. Tokens Trained
### Overview
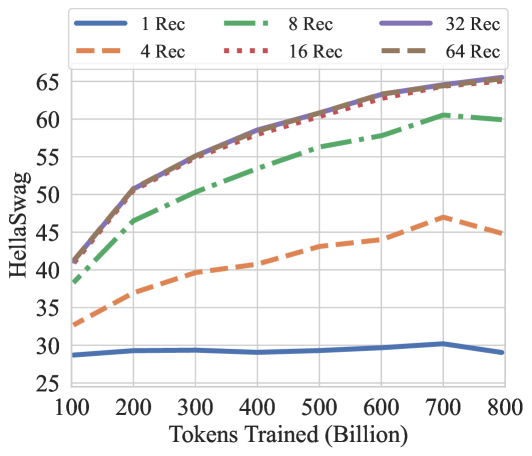
This image presents a line chart illustrating the performance of different models on the HellaSwag benchmark as a function of the number of tokens trained. The chart compares models with varying numbers of "Rec" (likely referring to retrieval or layers), ranging from 1 to 64.
### Components/Axes
* **X-axis:** "Tokens Trained (Billion)" - Scale ranges from approximately 100 to 800 billion tokens.
* **Y-axis:** "HellaSwag" - Scale ranges from approximately 25 to 65.
* **Legend:** Located at the top-right of the chart. Contains the following lines and their corresponding colors:
* 1 Rec (Blue) - Solid line
* 4 Rec (Orange) - Dashed line
* 8 Rec (Green) - Dashed-dotted line
* 16 Rec (Red) - Dotted line
* 32 Rec (Purple) - Solid line
* 64 Rec (Gray) - Dashed line
### Detailed Analysis
The chart displays six lines, each representing a model with a different number of "Rec" units.
* **1 Rec (Blue):** The line starts at approximately 29 at 100 billion tokens, rises to a peak of around 31 at 300 billion tokens, and then declines to approximately 28 at 800 billion tokens.
* **4 Rec (Orange):** The line begins at approximately 32 at 100 billion tokens, steadily increases to around 44 at 800 billion tokens.
* **8 Rec (Green):** The line starts at approximately 42 at 100 billion tokens, increases to around 59 at 800 billion tokens.
* **16 Rec (Red):** The line begins at approximately 45 at 100 billion tokens, rises rapidly to around 62 at 400 billion tokens, and plateaus around 63-64 from 400 to 800 billion tokens.
* **32 Rec (Purple):** The line starts at approximately 46 at 100 billion tokens, increases rapidly to around 63 at 400 billion tokens, and plateaus around 63-64 from 400 to 800 billion tokens.
* **64 Rec (Gray):** The line begins at approximately 48 at 100 billion tokens, increases to around 47 at 800 billion tokens.
### Key Observations
* The 16 Rec and 32 Rec models achieve the highest HellaSwag scores, plateauing at approximately 63-64 after 400 billion tokens.
* The 1 Rec model shows a relatively flat performance curve, with a slight initial increase followed by a decline.
* The 4 Rec model exhibits a consistent, but relatively slow, increase in performance.
* The 8 Rec model shows a steady increase in performance, but remains below the 16 and 32 Rec models.
* The 64 Rec model shows a slight increase in performance, but remains below the 16 and 32 Rec models.
### Interpretation
The data suggests that increasing the number of "Rec" units initially improves performance on the HellaSwag benchmark. However, there appears to be a diminishing return, as the 16 and 32 Rec models reach a plateau in performance after a certain number of tokens trained. The 1 Rec model's declining performance suggests that it may be overfitting or struggling to capture the complexity of the task. The 64 Rec model's performance is similar to the 8 Rec model, suggesting that there may be an optimal number of "Rec" units beyond which further increases do not yield significant improvements. The plateauing of the 16 and 32 Rec models indicates that the models have reached their capacity to learn from the available data, or that the HellaSwag benchmark itself has a limited capacity to differentiate between models with higher "Rec" counts. The chart demonstrates the importance of model capacity and training data size in achieving optimal performance on language understanding tasks.