## Pie Chart: Categorization of Prominent Pattern
### Overview
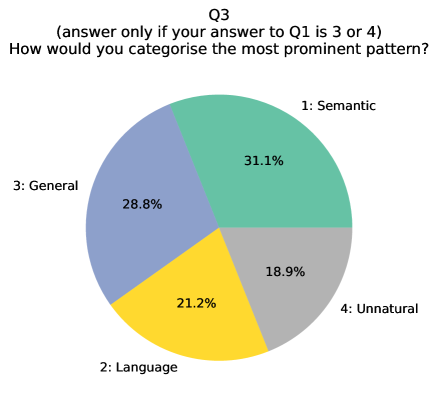
The image is a pie chart presenting the results of a survey question (Q3) asking respondents to categorize the most prominent pattern. The question was only asked if the respondent's answer to question Q1 was 3 or 4. The pie chart is divided into four categories: Semantic, Language, General, and Unnatural, with each slice representing the percentage of respondents who selected that category.
### Components/Axes
* **Title:** Q3 (answer only if your answer to Q1 is 3 or 4) How would you categorise the most prominent pattern?
* **Categories:**
* 1: Semantic (teal)
* 2: Language (yellow)
* 3: General (light purple)
* 4: Unnatural (light gray)
* **Percentages:** Each slice is labeled with its corresponding percentage.
### Detailed Analysis
* **1: Semantic (teal):** 31.1% - Located in the top-right quadrant of the pie chart.
* **2: Language (yellow):** 21.2% - Located in the bottom-left quadrant of the pie chart.
* **3: General (light purple):** 28.8% - Located in the top-left quadrant of the pie chart.
* **4: Unnatural (light gray):** 18.9% - Located in the bottom-right quadrant of the pie chart.
### Key Observations
* The "Semantic" category has the highest percentage (31.1%), indicating it was the most frequently selected category.
* The "Unnatural" category has the lowest percentage (18.9%).
* The "General" category is the second most frequent with 28.8%.
* The "Language" category is the third most frequent with 21.2%.
### Interpretation
The pie chart illustrates the distribution of responses to the question of how respondents would categorize the most prominent pattern. The results suggest that "Semantic" patterns were the most commonly identified, followed by "General" patterns. "Unnatural" patterns were the least frequently identified. The data provides insight into how individuals perceive and categorize patterns, with a preference towards semantic interpretations. The fact that the question was conditional on the answer to Q1 being 3 or 4 suggests that the respondents may have already been primed to consider certain types of patterns.