\n
## Pie Chart: Q3 - Pattern Categorization
### Overview
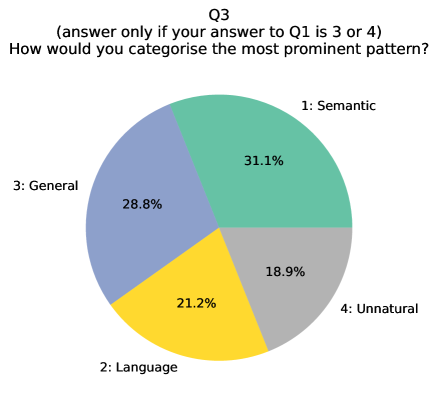
This image presents a pie chart displaying the distribution of responses to question Q3, contingent on a prior answer of 3 or 4 to question Q1. The question asks respondents to categorize the most prominent pattern observed. The chart shows the percentage breakdown of four categories: Semantic, Language, General, and Unnatural.
### Components/Axes
* **Title:** Q3
* **Subtitle:** (answer only if your answer to Q1 is 3 or 4)
* **Question:** How would you categorise the most prominent pattern?
* **Categories:**
* 1: Semantic
* 2: Language
* 3: General
* 4: Unnatural
* **Values:** Percentages representing the proportion of responses for each category.
### Detailed Analysis
The pie chart is divided into four segments, each representing a category and its corresponding percentage.
* **Semantic (Green):** This segment occupies the largest portion of the pie chart, representing approximately 31.1% of the responses. It is positioned at the top of the chart.
* **Language (Yellow):** This segment represents approximately 21.2% of the responses. It is located to the right of the Semantic segment.
* **General (Blue):** This segment represents approximately 28.8% of the responses. It is positioned to the left of the Semantic segment.
* **Unnatural (Grey):** This segment represents approximately 18.9% of the responses. It is located at the bottom of the chart.
### Key Observations
The most frequent response category is "Semantic," with approximately 31.1% of respondents selecting it. "General" and "Language" are relatively close in proportion, at 28.8% and 21.2% respectively. "Unnatural" receives the fewest responses, at 18.9%.
### Interpretation
The data suggests that, among those who answered 3 or 4 to Q1, the most prominent pattern observed is considered to be "Semantic." This implies that the underlying phenomenon being investigated is often perceived as relating to meaning, interpretation, or conceptual understanding. The relatively high proportion of "General" responses suggests a significant number of respondents find the pattern to be broad or not easily categorized. The lower proportion of "Unnatural" responses indicates that the pattern is not commonly perceived as artificial or anomalous. The conditional nature of this question (dependent on Q1) suggests that these categorizations are specific to a subset of the overall respondent group, those who initially identified a particular characteristic in Q1. Further analysis would be needed to understand the nature of the pattern and the context in which it is being observed.