# Technical Diagram Analysis
## Overview
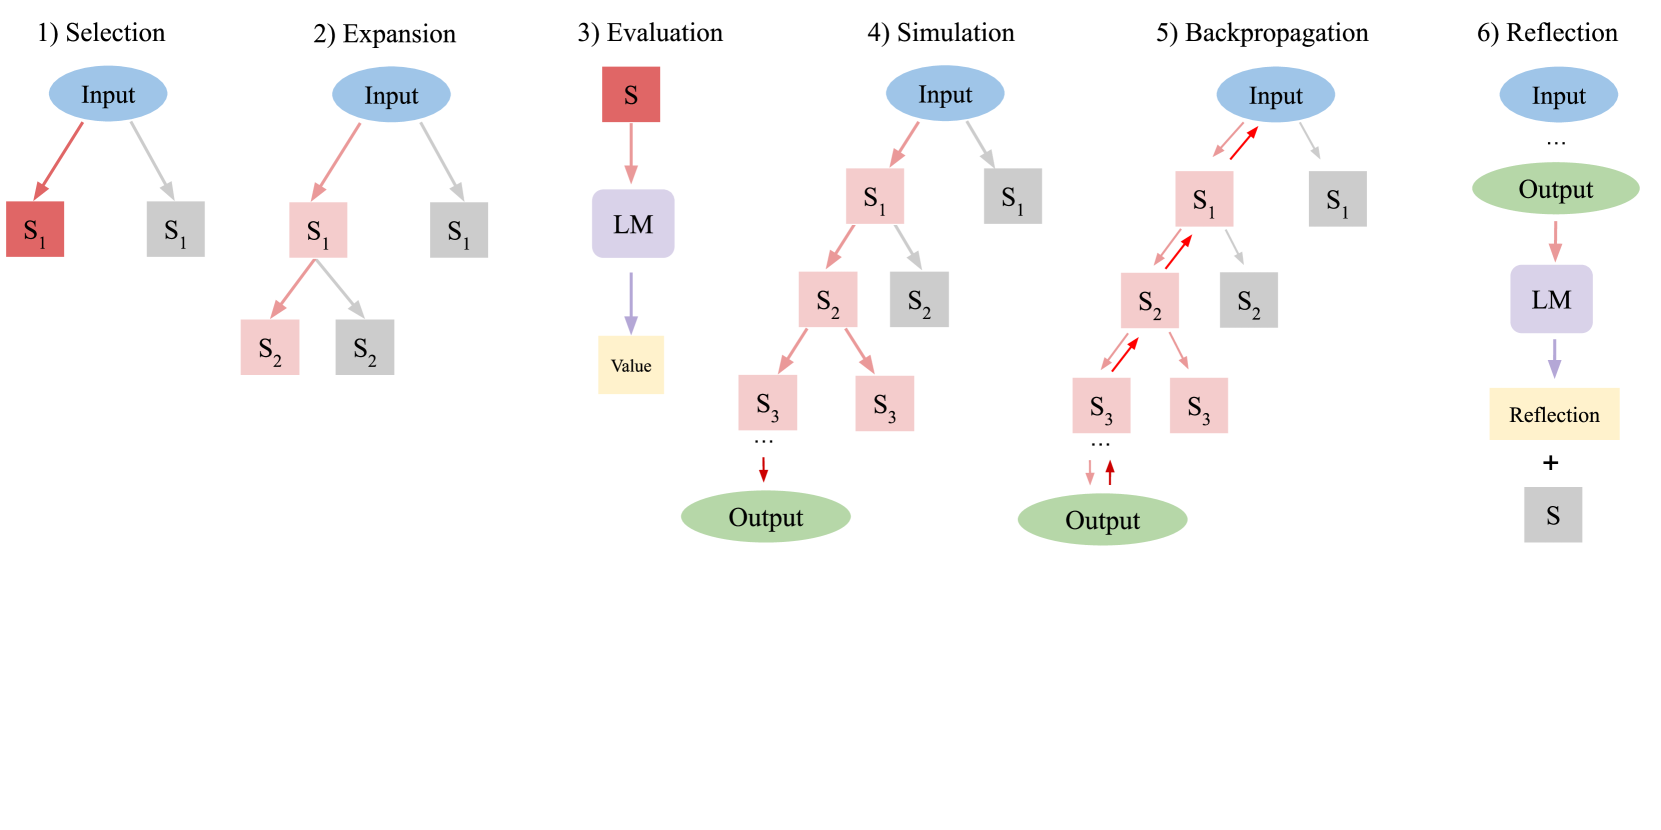
The diagram illustrates a six-stage computational process involving input processing, evaluation, simulation, and feedback mechanisms. The stages are labeled **1) Selection** through **6) Reflection**, with distinct color-coded components and directional flows.
---
### **1) Selection**
- **Input**: Single blue oval labeled "Input".
- **Output**:
- Red square labeled **S₁** (selected path).
- Gray square labeled **S₁** (alternative path).
- **Flow**: Input splits into two parallel paths (red and gray).
---
### **2) Expansion**
- **Input**: Single blue oval labeled "Input".
- **Output**:
- Pink square labeled **S₁** (primary expansion).
- Gray square labeled **S₁** (secondary expansion).
- **Flow**: Input branches into two parallel paths (pink and gray).
---
### **3) Evaluation**
- **Input**: Red square labeled **S** (from prior stage).
- **Process**:
- Purple rectangle labeled **LM** (Language Model).
- **Output**:
- Yellow rectangle labeled **Value** (evaluation result).
- **Flow**: Input → LM → Output.
---
### **4) Simulation**
- **Input**: Single blue oval labeled "Input".
- **Output**:
- Green oval labeled **Output**.
- **Components**:
- Pink squares labeled **S₂** (intermediate steps).
- Gray squares labeled **S₂** (alternative steps).
- **Flow**:
- Input → S₁ → S₂ (pink/gray) → Output.
- Arrows indicate sequential progression.
---
### **5) Backpropagation**
- **Input**: Single blue oval labeled "Input".
- **Output**:
- Green oval labeled **Output**.
- **Components**:
- Pink squares labeled **S₂** (feedback sources).
- Gray squares labeled **S₂** (feedback targets).
- **Flow**:
- Input → S₁ → S₂ (pink/gray).
- Red arrow indicates feedback from **S₂** to **S₁**.
- Bidirectional flow between S₂ nodes.
---
### **6) Reflection**
- **Input**: Single blue oval labeled "Input".
- **Process**:
- Purple rectangle labeled **LM**.
- Yellow rectangle labeled **Reflection**.
- **Output**:
- Green oval labeled **Output**.
- **Flow**:
- Input → LM → Reflection → Output.
- Final output combines **Reflection** and **S** (gray square).
---
### Key Observations
1. **Color Coding**:
- **Red**: Selected/primary paths (e.g., S₁ in Selection).
- **Gray**: Alternative/secondary paths (e.g., S₁ in Selection).
- **Pink**: Intermediate/expanded states (e.g., S₂ in Expansion).
- **Purple**: Language Model (LM) component.
- **Yellow**: Evaluation/Reflection outputs.
2. **Feedback Mechanism**:
- **Backpropagation** (Stage 5) introduces cyclic feedback from **S₂** to **S₁**, suggesting iterative refinement.
3. **Output Integration**:
- Final **Output** in Stage 6 merges **Reflection** (LM-processed) and **S** (gray square), indicating synthesis of evaluated and reflected data.
---
### Process Flow Summary
1. **Selection**: Initial input splits into selected (S₁) and alternative (S₁) paths.
2. **Expansion**: Selected path (S₁) expands into S₂ variants.
3. **Evaluation**: S is evaluated via LM to produce a Value.
4. **Simulation**: Input drives S₂ states to generate Output.
5. **Backpropagation**: Feedback from S₂ refines S₁.
6. **Reflection**: LM and Reflection synthesize final Output with S.
This diagram represents a cyclical, feedback-driven computational workflow, likely for optimization or decision-making tasks.