## Line Graph: Model Size Scaling
### Overview
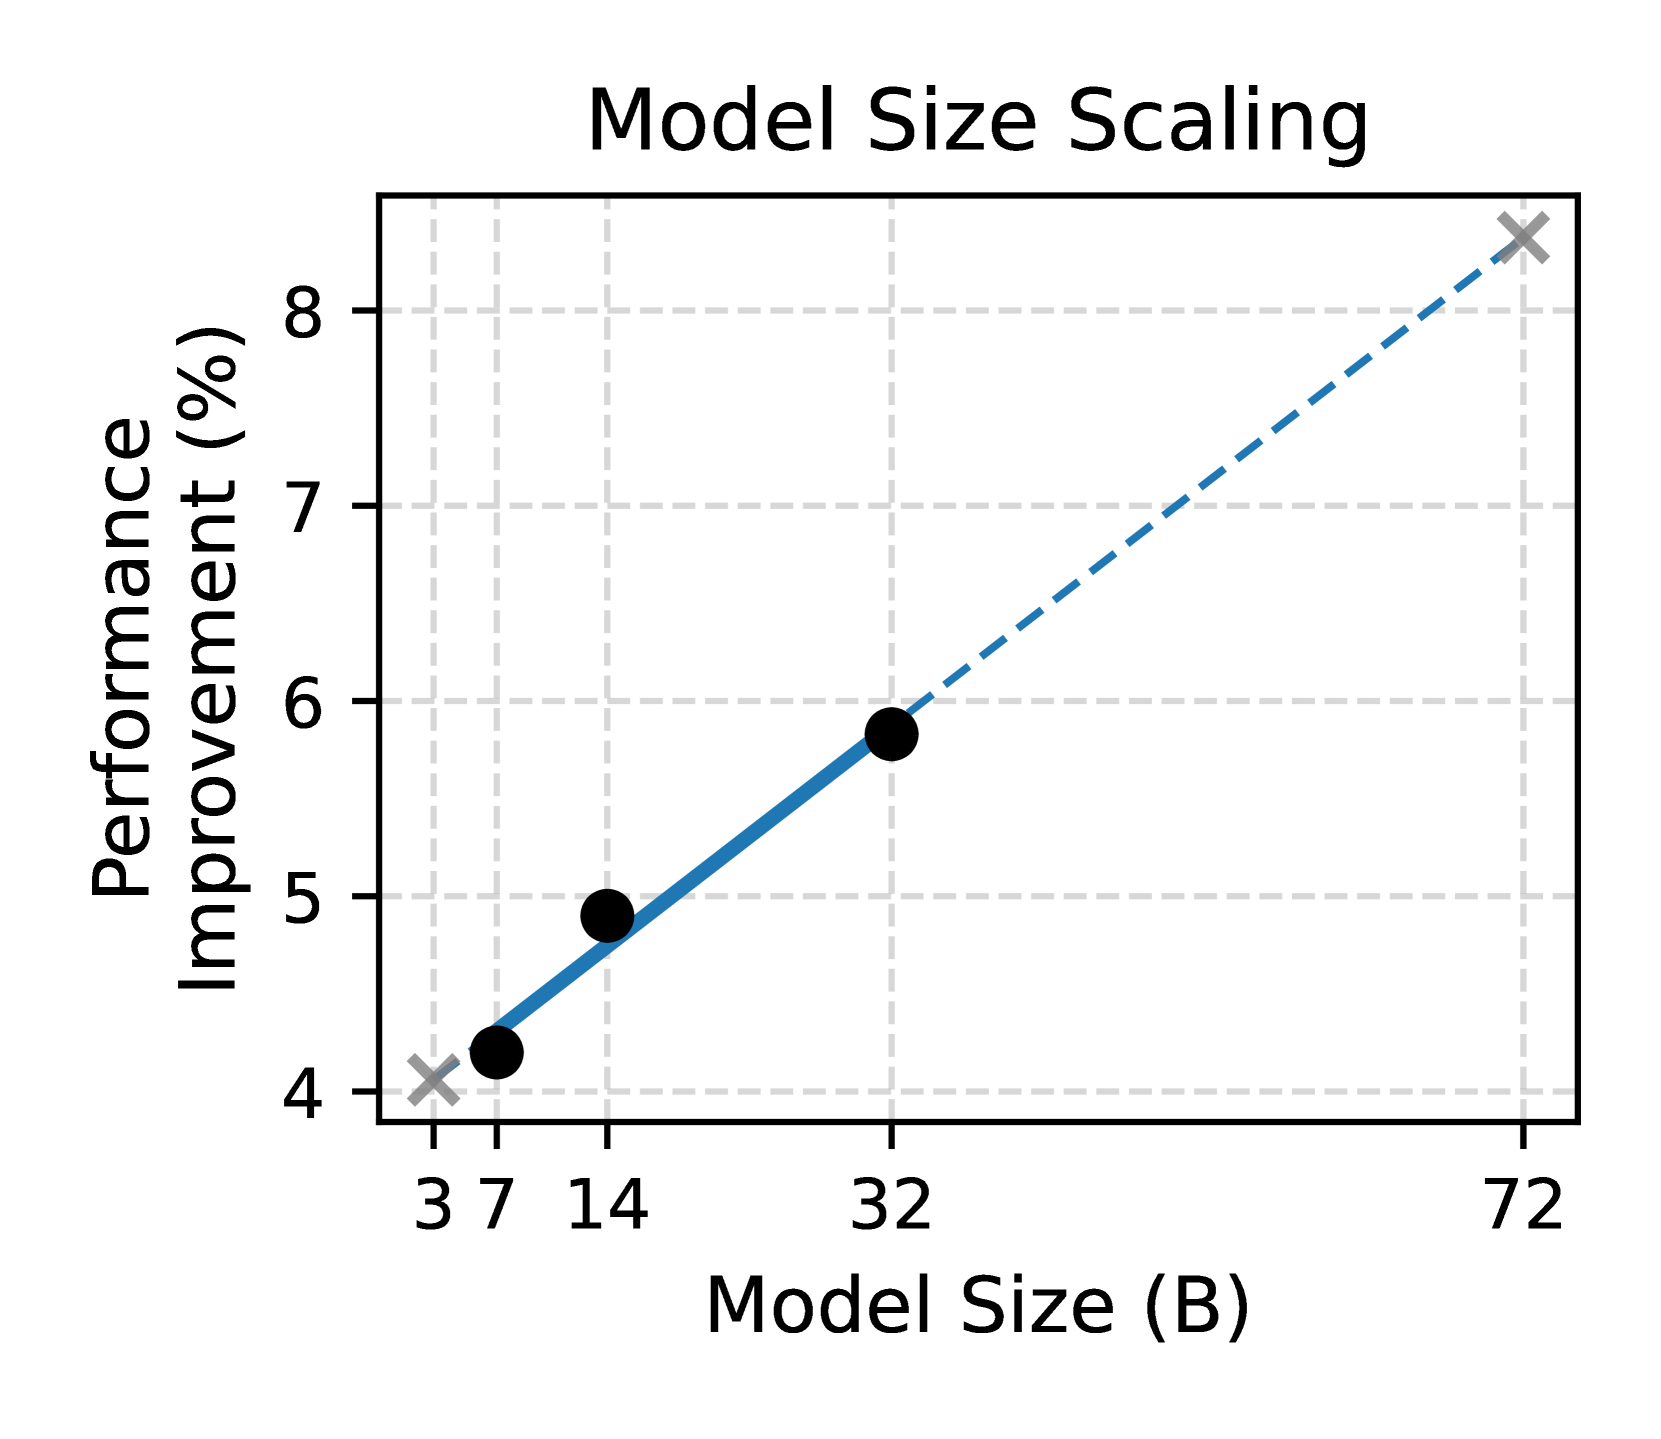
The image depicts a line graph titled "Model Size Scaling," illustrating the relationship between model size (in billions of parameters, B) and performance improvement (in percentage). The graph includes a primary data series, a dashed trend line, and a legend. Data points are plotted with black circles, and a gray "X" marks the final point.
---
### Components/Axes
- **Title**: "Model Size Scaling" (centered at the top).
- **X-Axis**:
- Label: "Model Size (B)".
- Scale: Logarithmic increments (3, 7, 14, 32, 72).
- **Y-Axis**:
- Label: "Performance Improvement (%)".
- Scale: Linear from 4% to 8% (with gridlines at 4, 5, 6, 7, 8).
- **Legend**:
- Position: Top-right corner.
- Elements:
- Blue dashed line with a black circle (labeled "Model Size Scaling").
- Gray "X" symbol (no explicit label, but visually distinct).
- **Data Points**:
- Black circles connected by a solid blue line.
- Final point (72B) marked with a gray "X".
---
### Detailed Analysis
- **Data Series**:
- **Point 1**: (3B, 4.1%) – Bottom-left corner.
- **Point 2**: (7B, 4.9%) – Midway between 3B and 14B.
- **Point 3**: (14B, 5.8%) – Midway between 7B and 32B.
- **Point 4**: (32B, 6.8%) – Midway between 14B and 72B.
- **Point 5**: (72B, 8.3%) – Top-right corner, marked with a gray "X".
- **Trend Line**:
- Dashed blue line connecting all data points, showing a positive linear relationship.
- Slope: Approximately 0.05% improvement per billion parameters (calculated from (8.3 - 4.1)/(72 - 3) ≈ 0.05).
---
### Key Observations
1. **Performance Improvement**:
- Increases monotonically with model size.
- From 4.1% (3B) to 8.3% (72B), a **4.2% absolute improvement**.
2. **Trend Line**:
- Suggests a linear relationship between model size and performance improvement.
- No visible curvature, indicating consistent scaling efficiency.
3. **Final Data Point**:
- The gray "X" at (72B, 8.3%) may indicate an outlier, a special case, or a capped performance limit.
---
### Interpretation
- **Primary Insight**: Larger models (in terms of parameter count) correlate with higher performance improvements. This aligns with common trends in machine learning, where increased model capacity often enhances task performance.
- **Scaling Efficiency**: The linear trend line implies that performance gains are proportional to model size across the observed range (3B–72B). However, the absence of diminishing returns (e.g., flattening curve) is unusual, as real-world models often exhibit saturation effects at larger scales.
- **Final Point Anomaly**: The gray "X" at 72B could signify:
- A theoretical maximum performance improvement.
- A data point excluded from the trend line calculation.
- A benchmark or target value for comparison.
- **Practical Implications**:
- For applications requiring performance gains, scaling model size appears effective within this range.
- The lack of diminishing returns suggests either an idealized scenario or a specific architectural advantage (e.g., optimized training, novel algorithms).
---
### Notes on Uncertainty
- **Data Point Precision**: Values like 4.1% and 8.3% are approximate, as the graph lacks error bars or confidence intervals.
- **Trend Line Assumptions**: The dashed line assumes a perfect linear relationship, which may not hold beyond the observed data range (e.g., saturation at 72B).