\n
## Bar Chart: ProcessBench Mean F1 Score Comparison
### Overview
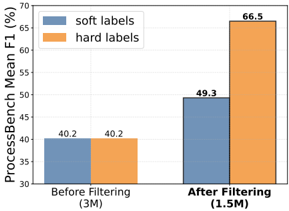
This bar chart compares the ProcessBench Mean F1 score for "soft labels" and "hard labels" before and after filtering data. The x-axis represents the data filtering state ("Before Filtering" and "After Filtering"), and the y-axis represents the ProcessBench Mean F1 score in percentage (%). Two bars are displayed for each filtering state, one for soft labels (blue) and one for hard labels (orange).
### Components/Axes
* **X-axis Title:** Filtering State
* Markers: "Before Filtering (3M)", "After Filtering (1.5M)"
* **Y-axis Title:** ProcessBench Mean F1 (%)
* Scale: 30 to 70, with increments of 5.
* **Legend:** Located at the top-left corner.
* "soft labels" - Blue color
* "hard labels" - Orange color
### Detailed Analysis
The chart presents four data points, each represented by a bar.
* **Before Filtering (3M):**
* Soft Labels (Blue): The bar reaches approximately 40.2%. The line slopes upward slightly.
* Hard Labels (Orange): The bar reaches approximately 40.2%. The line slopes upward slightly.
* **After Filtering (1.5M):**
* Soft Labels (Blue): The bar reaches approximately 49.3%. The line slopes upward significantly.
* Hard Labels (Orange): The bar reaches approximately 66.5%. The line slopes upward significantly.
### Key Observations
* Both soft and hard labels show an increase in ProcessBench Mean F1 score after filtering.
* The increase is more pronounced for hard labels after filtering, jumping from 40.2% to 66.5%.
* Before filtering, the F1 scores for soft and hard labels are nearly identical.
* After filtering, hard labels significantly outperform soft labels.
### Interpretation
The data suggests that filtering the data improves the performance of both soft and hard labels on the ProcessBench benchmark. However, the improvement is substantially greater for hard labels. This could indicate that hard labels are more sensitive to noisy or irrelevant data, and benefit more from the filtering process. The numbers in parentheses (3M and 1.5M) likely represent the dataset size before and after filtering, respectively, suggesting that the filtering process reduced the dataset size by half. The substantial performance gain with hard labels after filtering suggests that the filtering process effectively removed data points that negatively impacted the hard label model. The initial similarity in performance before filtering suggests that both labeling approaches are equally effective when applied to the full, unfiltered dataset.