# Technical Document Analysis: ProcessBench Mean F1 Scores
## Chart Description
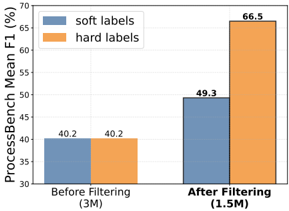
The image is a **bar chart** comparing **ProcessBench Mean F1 scores (%)** before and after filtering, segmented by **soft labels** and **hard labels**. The chart uses two colors to distinguish the two label types and includes numerical annotations for data points.
---
### **Key Components**
1. **Title**:
- "ProcessBench Mean F1 (%)" (displayed at the top of the chart).
2. **Axes**:
- **X-axis**:
- Labels:
- "Before Filtering (3M)"
- "After Filtering (1.5M)"
- Position: Horizontal axis at the bottom.
- **Y-axis**:
- Label: "ProcessBench Mean F1 (%)"
- Range: 30% to 70% (increments of 5%).
- Position: Vertical axis on the left.
3. **Legend**:
- Located in the **top-right corner** of the chart.
- **Colors**:
- **Blue**: Soft labels
- **Orange**: Hard labels
- Text: "soft labels" (blue) and "hard labels" (orange).
4. **Data Points**:
- **Before Filtering (3M)**:
- Soft labels: 40.2%
- Hard labels: 40.2%
- **After Filtering (1.5M)**:
- Soft labels: 49.3%
- Hard labels: 66.5%
---
### **Trends and Observations**
1. **Pre-Filtering**:
- Both soft and hard labels start at **40.2%**, indicating no initial performance gap.
- Spatial grounding: Both bars are aligned at the same height on the y-axis.
2. **Post-Filtering**:
- **Soft labels** increase to **49.3%** (↑ 9.1%).
- **Hard labels** surge to **66.5%** (↑ 26.3%).
- Visual trend: Hard labels show a steeper upward slope compared to soft labels.
- Spatial grounding: Hard labels (orange) are significantly taller than soft labels (blue) in the "After Filtering" group.
3. **Legend Consistency**:
- Colors match the legend exactly:
- Blue bars correspond to "soft labels."
- Orange bars correspond to "hard labels."
---
### **Critical Notes**
- **No other languages** are present in the chart.
- **No data tables** or additional diagrams are included.
- **Component isolation**: The chart focuses solely on the bar graph, with no extraneous elements (e.g., headers, footers).
---
### **Summary**
The chart demonstrates that filtering improves ProcessBench Mean F1 scores, with **hard labels** achieving a more substantial gain (+26.3%) compared to **soft labels** (+9.1%). The legend and color coding are consistent, and all numerical values are explicitly annotated.