## Chart/Diagram Type: Posterior Density Distribution for Toxicity Probability
### Overview
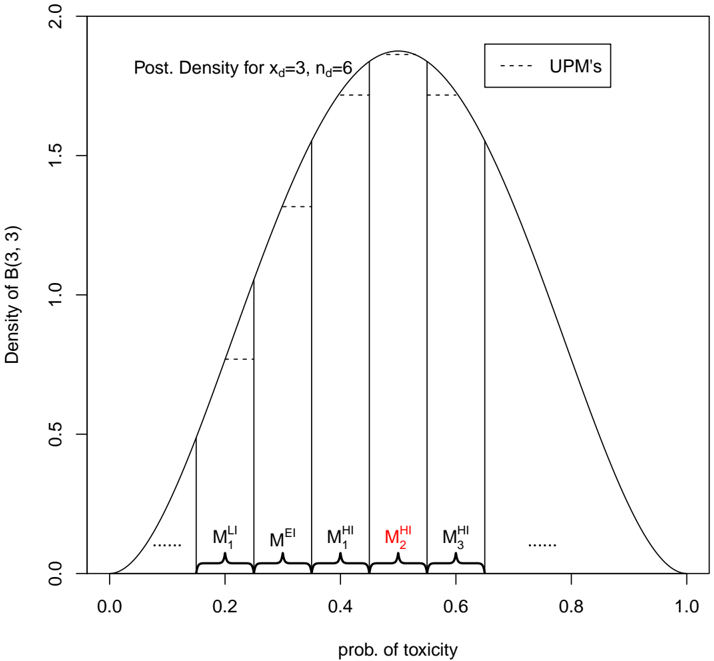
The image is a probability density function (PDF) plot titled "Post Density for x_d=3, n_d=6," showing the distribution of toxicity probability (x-axis) against density (y-axis). A dashed line labeled "UPMs" (likely a prior or reference distribution) is overlaid on the main density curve. Five vertical lines with labels (e.g., M1^LJ, M1^EI, etc.) mark specific points of interest on the x-axis.
---
### Components/Axes
- **X-axis**: "prob. of toxicity" (ranges from 0.0 to 1.0, with markers at 0.2, 0.4, 0.6, 0.8).
- **Y-axis**: "Density of B(3,3)" (ranges from 0.0 to 2.0, with markers at 0.0, 0.5, 1.0, 1.5, 2.0).
- **Legend**: Located in the top-right corner, labeled "UPMs" with a dashed line.
- **Vertical Lines**: Five dashed vertical lines with labels:
- M1^LJ (x ≈ 0.2)
- M1^EI (x ≈ 0.35)
- M1^HI (x ≈ 0.45)
- M2^HI (x ≈ 0.55)
- M3^HI (x ≈ 0.65)
---
### Detailed Analysis
- **Main Density Curve**:
- Peaks at x ≈ 0.45 (y ≈ 1.8), indicating the highest density of toxicity probability.
- Symmetrical shape, consistent with a Beta(3,3) distribution (symmetric when α = β).
- The curve tapers off toward both ends (x = 0 and x = 1), with density approaching zero.
- **UPMs Line**:
- A dashed line (likely a prior or reference distribution) that aligns with the main curve but is slightly offset.
- Peaks at x ≈ 0.45, matching the main curve’s peak.
- **Vertical Lines**:
- **M1^LJ** (x ≈ 0.2): Lowest density (~0.3).
- **M1^EI** (x ≈ 0.35): Moderate density (~0.6).
- **M1^HI** (x ≈ 0.45): Highest density (~1.8).
- **M2^HI** (x ≈ 0.55): Slightly lower density (~1.5).
- **M3^HI** (x ≈ 0.65): Lower density (~0.8).
---
### Key Observations
1. **Peak Density**: The highest density occurs at x ≈ 0.45, suggesting the most probable toxicity level is ~45%.
2. **Symmetry**: The Beta(3,3) distribution is symmetric, with equal influence from both sides of the peak.
3. **UPMs Alignment**: The UPMs line closely matches the main curve, indicating it may represent a prior belief or a reference distribution.
4. **Vertical Line Labels**: The labels (e.g., M1^LJ, M1^HI) likely denote different model configurations or thresholds, with M1^HI at the peak.
---
### Interpretation
The graph illustrates the posterior density distribution of toxicity probability given x_d=3 (e.g., 3 toxic samples) and n_d=6 (e.g., 6 total samples). The UPMs line likely represents a prior distribution (e.g., a uniform or Beta prior) that is updated to the posterior distribution shown. The vertical lines (M1^LJ to M3^HI) may correspond to specific quantiles, thresholds, or model variants. The symmetry of the distribution suggests balanced evidence for and against toxicity, while the peak at 0.45 indicates a moderate probability of toxicity. The labels on the vertical lines could reflect different experimental conditions or model parameters influencing the toxicity probability.
---
**Note**: No non-English text is present. All labels and values are transcribed with approximate positioning based on the graph’s scale.