## Diagram: Geometric Representation of Time Series
### Overview
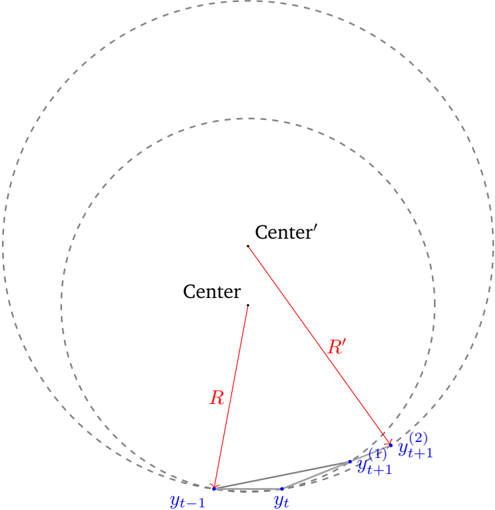
The image is a geometric diagram illustrating the relationship between points in a time series and two centers, labeled "Center" and "Center'". It shows the progression of points `y_t-1`, `y_t`, and `y_t+1` along a curved path, with radial lines connecting them to the centers. The diagram includes dashed circles centered on "Center" and "Center'", and lines connecting the time series points.
### Components/Axes
* **Centers:** Two points labeled "Center" and "Center'". "Center'" is located slightly above and to the right of "Center".
* **Time Series Points:** Three points labeled `y_t-1`, `y_t`, and `y_t+1` (with `y_t+1` having two versions, `y_t+1^(1)` and `y_t+1^(2)`). These points are positioned along a curved path.
* **Radial Lines:** Red lines connect "Center" to `y_t-1` and "Center'" to `y_t+1^(2)`. These lines are labeled with "R" and "R'" respectively.
* **Curved Path:** A dashed gray line represents the path along which the time series points progress. Two concentric dashed circles are centered on "Center", and one concentric dashed circle is centered on "Center'".
* **Connecting Lines:** Gray lines connect `y_t-1` to `y_t`, and `y_t` to `y_t+1^(1)`.
### Detailed Analysis
* **Centers:** "Center" is located at approximately (0.4, 0.4) relative to the image boundaries. "Center'" is located slightly above and to the right of "Center", at approximately (0.5, 0.5).
* **Time Series Points:**
* `y_t-1` is located at approximately (0.2, 0.8).
* `y_t` is located at approximately (0.35, 0.85).
* `y_t+1^(1)` is located at approximately (0.5, 0.8).
* `y_t+1^(2)` is located at approximately (0.6, 0.75).
* **Radial Lines:**
* The red line "R" connects "Center" to `y_t-1`.
* The red line "R'" connects "Center'" to `y_t+1^(2)`.
* **Curved Path:** The time series points appear to follow a path that curves upwards and to the right. The dashed circles centered on "Center" and "Center'" suggest a radial relationship.
* **Connecting Lines:** The gray lines connecting the time series points form a piecewise linear approximation of the curved path.
### Key Observations
* The diagram illustrates the progression of points in a time series.
* The radial lines "R" and "R'" suggest a relationship between the time series points and the centers.
* The curved path indicates a non-linear trend in the time series.
* The two versions of `y_t+1` suggest a possible deviation or alternative path.
### Interpretation
The diagram likely represents a model or concept related to time series analysis. The centers "Center" and "Center'" could represent attractors or reference points influencing the trajectory of the time series. The radial lines "R" and "R'" might represent the influence or distance from these centers. The two versions of `y_t+1` could indicate a branching or uncertainty in the future path of the time series. The diagram could be used to visualize concepts such as dynamic systems, state-space models, or forecasting methods. The diagram suggests that the time series is influenced by two centers, and that its future path is not entirely deterministic.