\n
## Diagram: Circular Progression with Radial Labels
### Overview
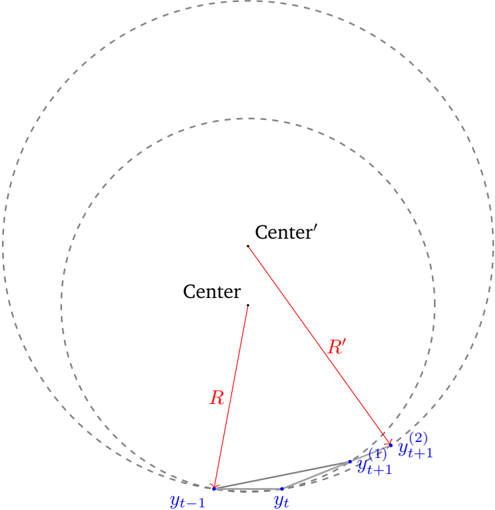
The image depicts a diagram illustrating a circular progression or iterative process. It features two concentric circles, with radial lines and labels indicating points and distances. The diagram appears to model a sequence of points (yt-1, yt, yt+1) moving along the circumference of a circle, with a second circle representing a potential future state.
### Components/Axes
The diagram consists of the following components:
* **Two Concentric Circles:** An inner circle and an outer circle, both represented by dashed lines.
* **Center & Center':** Labels indicating the centers of the inner and outer circles respectively.
* **R & R':** Labels indicating the radii of the inner and outer circles respectively. These are represented by red lines extending from the centers to points on the circumference.
* **yt-1, yt, yt+1:** Labels representing points on the inner circle, forming a sequence.
* **yt+1(2):** Label representing a point on the outer circle, potentially a future state of yt+1.
* **yt+1(f):** Label representing a point on the outer circle, potentially a future state of yt+1.
* **Radial Lines:** Red lines connecting the centers to the labeled points.
* **Grey Line:** A short grey line segment connecting yt and yt+1.
* **Grey Arc:** A small grey arc connecting yt and yt+1(f).
There are no explicit axes in this diagram. The spatial arrangement of elements conveys relationships rather than numerical scales.
### Detailed Analysis / Content Details
The diagram illustrates a progression from point *yt-1* to *yt* to *yt+1* along the inner circle. The radius of the inner circle is labeled *R*. A second circle with radius *R'* surrounds the inner circle. Points *yt+1(2)* and *yt+1(f)* are located on the outer circle, suggesting a potential future state or projection of *yt+1*.
The distance between *Center* and *yt-1* is *R*.
The distance between *Center* and *yt* is *R*.
The distance between *Center* and *yt+1* is *R*.
The distance between *Center'* and *yt+1(2)* is *R'*.
The distance between *Center'* and *yt+1(f)* is *R'*.
The grey line segment between *yt* and *yt+1* suggests a small incremental step in the sequence. The grey arc between *yt* and *yt+1(f)* suggests a potential future trajectory.
### Key Observations
* The diagram emphasizes a circular or iterative process.
* The two circles suggest a transition or projection from a current state (inner circle) to a potential future state (outer circle).
* The labels *yt-1*, *yt*, and *yt+1* indicate a time-series or sequential progression.
* The radii *R* and *R'* suggest a scaling or expansion of the process.
### Interpretation
This diagram likely represents a model for a dynamic system that evolves over time. The inner circle represents the current state of the system, while the outer circle represents a possible future state. The points *yt-1*, *yt*, and *yt+1* represent the system's state at different time steps. The diagram suggests that the system's state evolves incrementally from one time step to the next, as indicated by the grey line segment. The outer circle and points *yt+1(2)* and *yt+1(f)* suggest that the system's future state is uncertain and may lie within a range of possibilities.
The use of radii *R* and *R'* could indicate a scaling factor or a change in the system's parameters over time. The diagram could be used to model a variety of phenomena, such as population growth, financial markets, or physical systems. The diagram is abstract and does not provide specific numerical data, but it conveys a clear conceptual model of a dynamic system. The diagram is a visual representation of a mathematical or computational model, likely used in a technical report or academic paper.