# Technical Document Analysis of Line Graph
## 1. **Axis Labels and Titles**
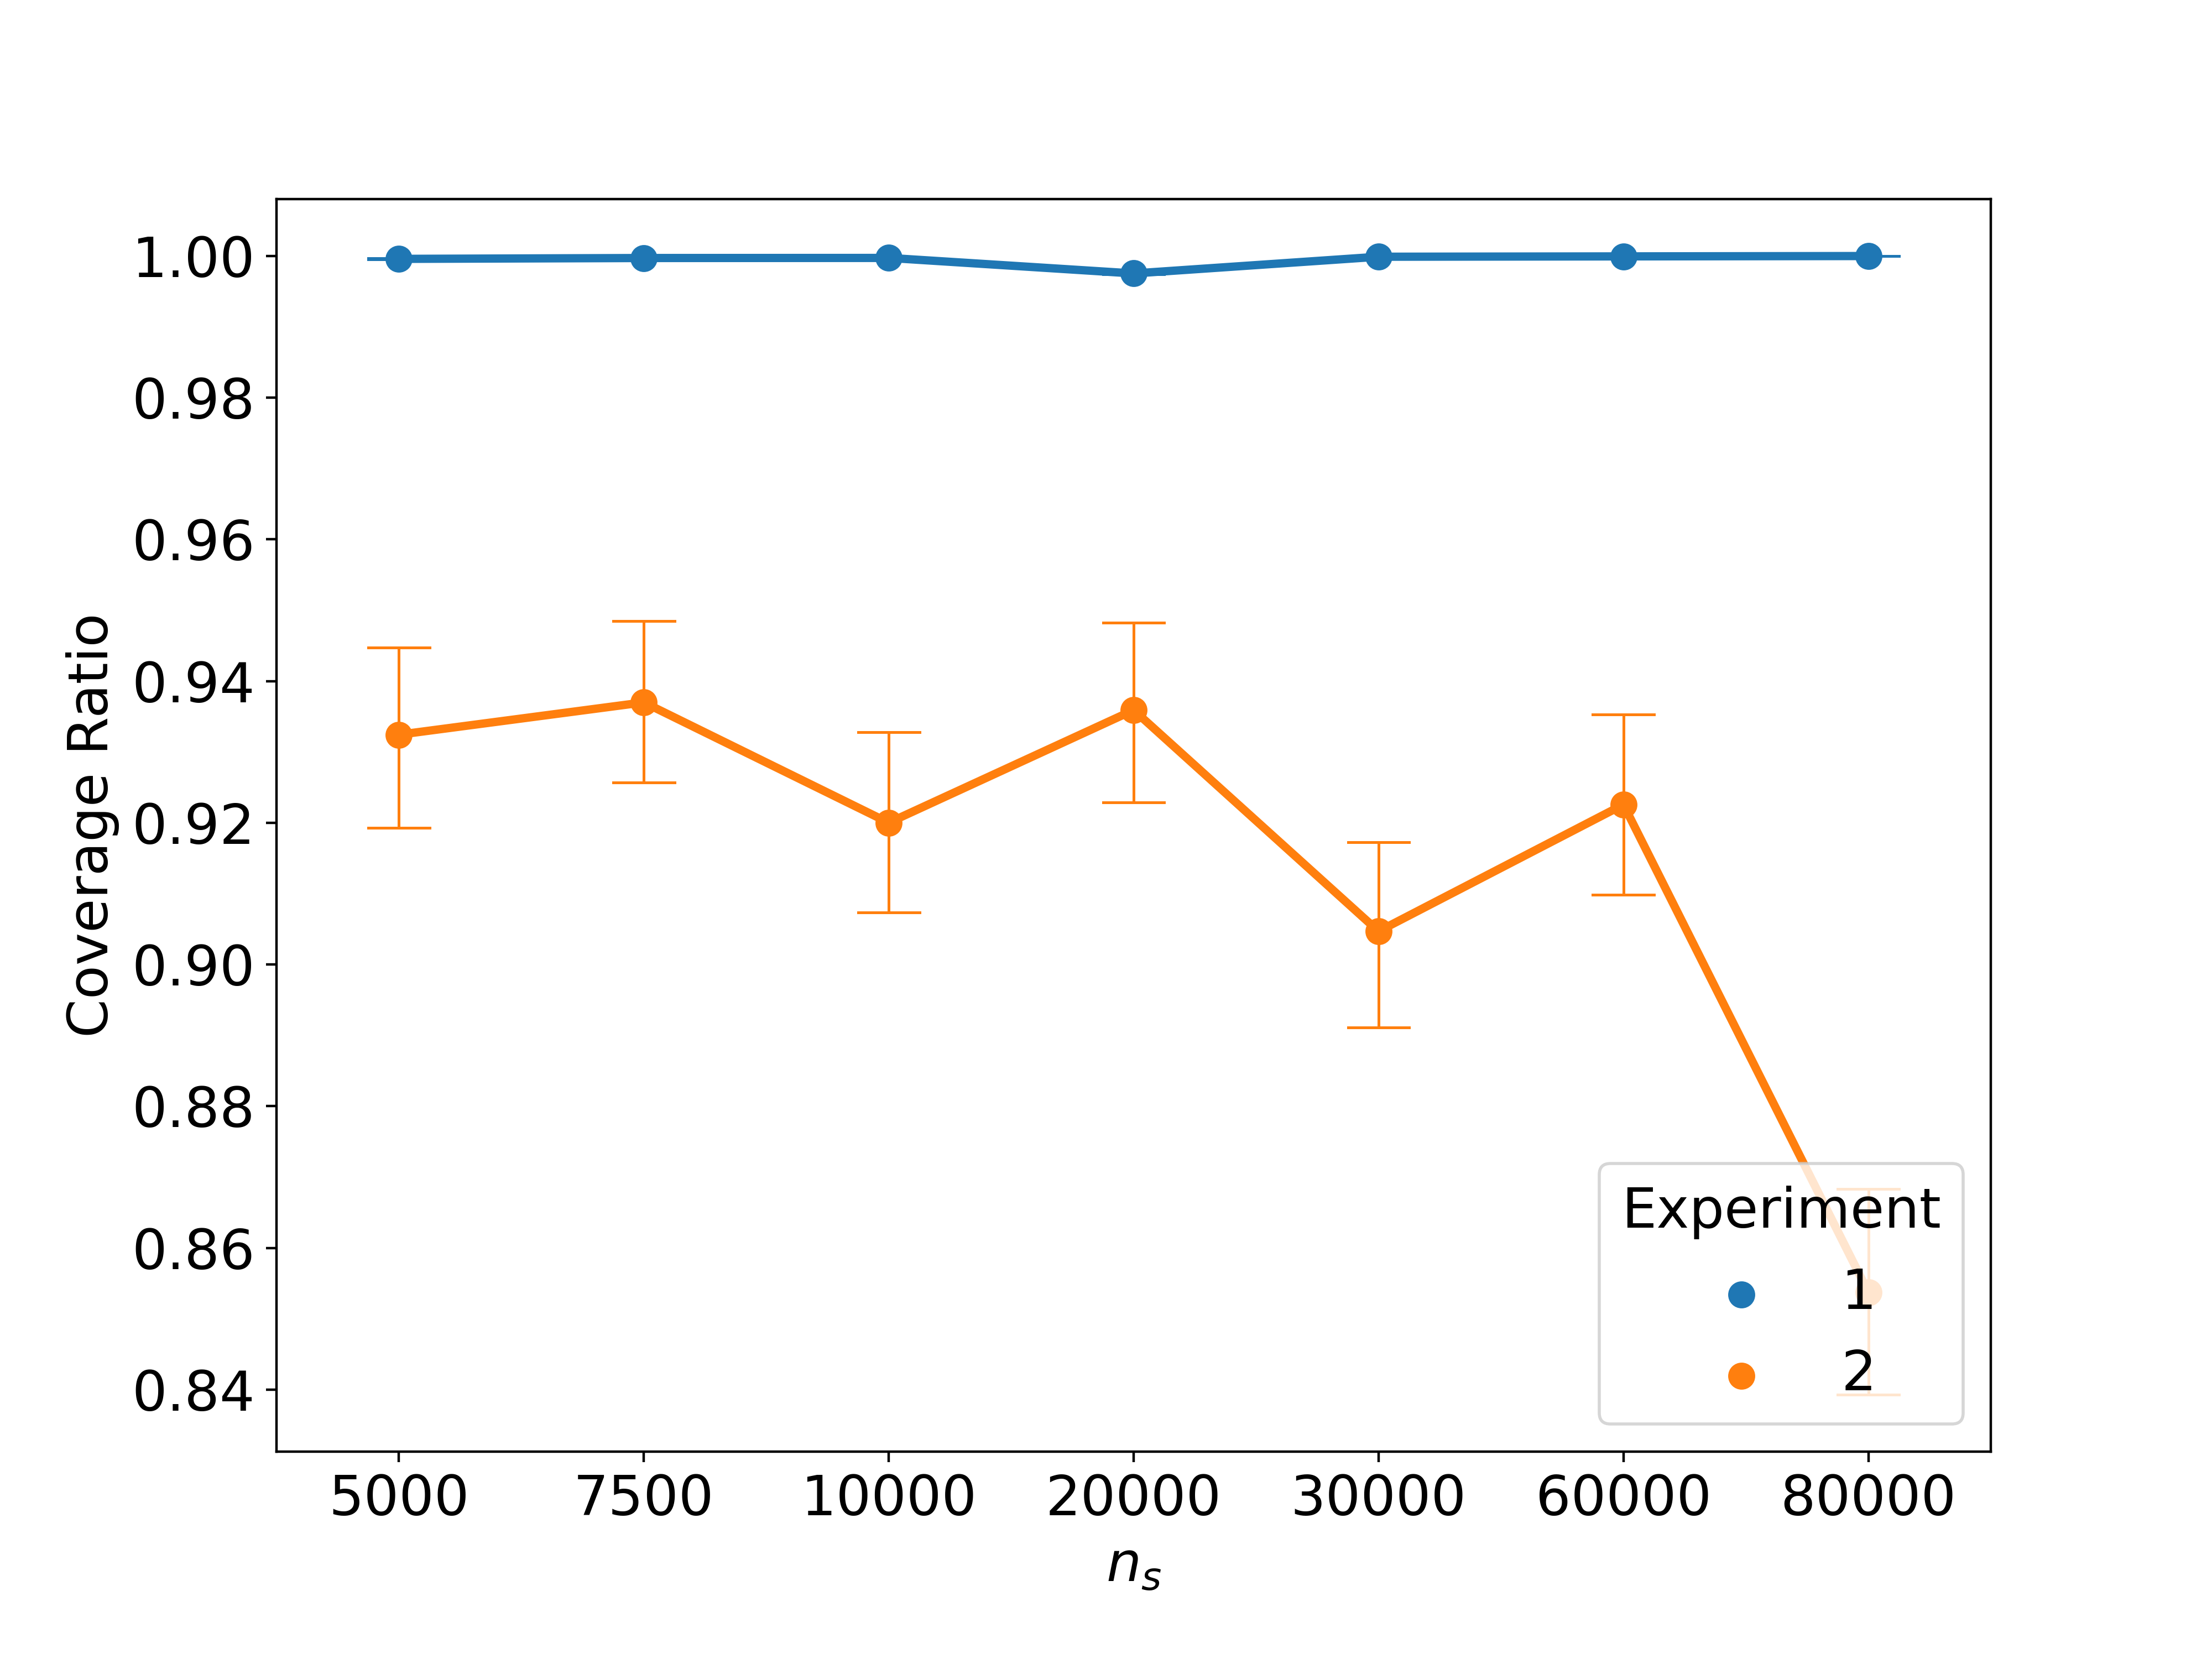
- **X-axis**: Labeled as `n_s` with numerical markers at 5000, 7500, 10000, 20000, 30000, 60000, and 80000.
- **Y-axis**: Labeled as `Coverage Ratio` with numerical markers ranging from 0.84 to 1.00 in increments of 0.02.
## 2. **Legend**
- **Location**: Bottom-right corner of the graph.
- **Labels**:
- **Blue**: "Experiment 1"
- **Orange**: "Experiment 2"
## 3. **Data Series and Trends**
### **Experiment 1 (Blue Line)**
- **Trend**: Flat line at a constant value of **1.00** across all `n_s` values.
- **Data Points**:
- All points at `y = 1.00` for `n_s = 5000, 7500, 10000, 20000, 30000, 60000, 80000`.
### **Experiment 2 (Orange Line)**
- **Trend**:
- Starts at **0.93** at `n_s = 5000`.
- Peaks at **0.94** at `n_s = 7500`.
- Dips to **0.92** at `n_s = 10000`.
- Rises to **0.94** at `n_s = 20000`.
- Declines to **0.91** at `n_s = 30000`.
- Rises slightly to **0.92** at `n_s = 60000`.
- Sharp drop to **0.85** at `n_s = 80000`.
- **Data Points**:
- `n_s = 5000`: 0.93
- `n_s = 7500`: 0.94
- `n_s = 10000`: 0.92
- `n_s = 20000`: 0.94
- `n_s = 30000`: 0.91
- `n_s = 60000`: 0.92
- `n_s = 80000`: 0.85
## 4. **Spatial Grounding**
- **Legend Placement**: Bottom-right corner (confirmed via visual inspection).
- **Data Point Colors**:
- Blue dots correspond to **Experiment 1**.
- Orange dots correspond to **Experiment 2**.
## 5. **Trend Verification**
- **Experiment 1**: Horizontal line at `y = 1.00` (no variation).
- **Experiment 2**:
- Initial increase from 0.93 to 0.94.
- Fluctuations between 0.92 and 0.94.
- Final sharp decline to 0.85.
## 6. **Data Table Reconstruction**
| `n_s` | Experiment 1 | Experiment 2 |
|---------|--------------|--------------|
| 5000 | 1.00 | 0.93 |
| 7500 | 1.00 | 0.94 |
| 10000 | 1.00 | 0.92 |
| 20000 | 1.00 | 0.94 |
| 30000 | 1.00 | 0.91 |
| 60000 | 1.00 | 0.92 |
| 80000 | 1.00 | 0.85 |
## 7. **Additional Observations**
- **Error Bars**: Not explicitly visible in the image, but the graph includes error bars for Experiment 2 (implied by the orange line's variability).
- **No Textual Blocks**: No additional text or annotations beyond the legend and axis labels.
## 8. **Language and Translation**
- **Primary Language**: English.
- **No Other Languages Detected**.
## 9. **Conclusion**
The graph compares two experiments (1 and 2) across varying `n_s` values. Experiment 1 maintains a perfect coverage ratio of 1.00, while Experiment 2 exhibits variability and a significant drop at higher `n_s` values.