## Diagram Type: Flowchart
### Overview
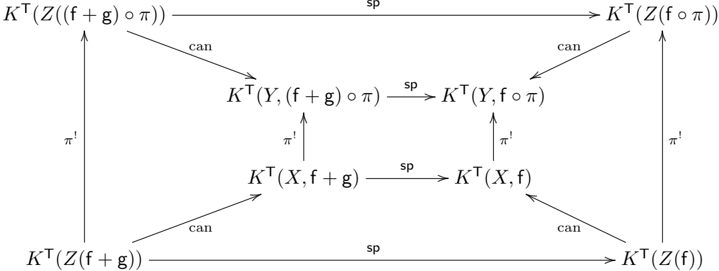
The image depicts a flowchart with various nodes and arrows indicating the flow of information or processes. The chart includes mathematical expressions and symbols, suggesting it is related to a mathematical or scientific concept.
### Components/Axes
- **Nodes**: Represent different stages or elements in the process.
- **Arrows**: Indicate the direction of flow or relationship between nodes.
- **Mathematical Expressions**: Include symbols such as \( K^T \), \( (f + g) \), \( \pi \), and \( sp \), which are likely related to transformations or operations in a mathematical context.
### Detailed Analysis or ### Content Details
- The flowchart starts with \( K^T(Z(f + g)) \) and ends with \( K^T(Z(f)) \), suggesting a transformation process.
- There are multiple intermediate steps involving \( K^T \) applied to different functions and variables.
- The expressions \( (f + g) \) and \( \pi \) are used in the transformations, indicating possible operations like addition and a projection or mapping.
### Key Observations
- The flowchart appears to be a step-by-step process for transforming a function \( Z \) using \( K^T \).
- The use of \( sp \) suggests a specific type of transformation or mapping.
- The presence of \( \pi \) might indicate a projection or a mapping to a lower-dimensional space.
### Interpretation
The flowchart demonstrates a mathematical transformation process where a function \( Z \) is transformed using \( K^T \) and possibly a projection or mapping indicated by \( \pi \). The final result is \( K^T(Z(f)) \), which suggests that the transformation is applied to the function \( Z \) with the input \( f \). The use of \( sp \) could imply a specific type of transformation or mapping that is detailed in the context of the mathematical or scientific concept being represented.