## Line Chart: Eigenvalue Spectra of Head Similarity Matrices (2.5B)
### Overview
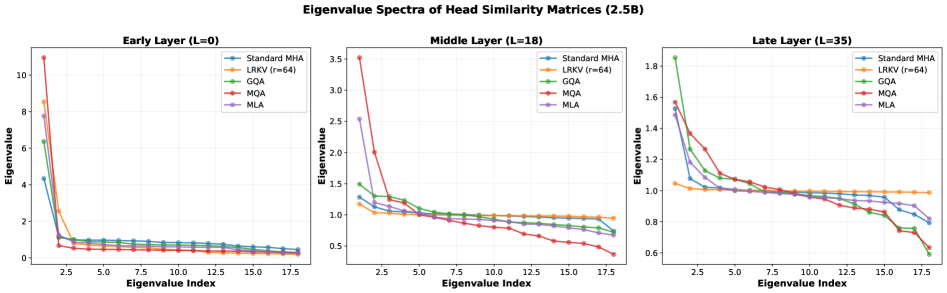
The image presents three line charts comparing the eigenvalue spectra of head similarity matrices across three transformer layers: Early Layer (L=0), Middle Layer (L=18), and Late Layer (L=35). Five methods are compared: Standard MHA, LRKV (r=64), GQA, MQA, and MLA. Each chart shows eigenvalues plotted against eigenvalue indices (2.5–17.5), with distinct color-coded lines for each method.
---
### Components/Axes
- **X-axis**: Eigenvalue Index (2.5 to 17.5, increments of 2.5).
- **Y-axis**: Eigenvalue (ranging from 0 to ~10 in Early Layer, 0 to ~3.5 in Middle Layer, and 0 to ~1.8 in Late Layer).
- **Legends**: Positioned on the right of each subplot, with colors:
- Blue: Standard MHA
- Orange: LRKV (r=64)
- Green: GQA
- Red: MQA
- Purple: MLA
---
### Detailed Analysis
#### Early Layer (L=0)
- **Standard MHA (blue)**: Starts at ~10, drops sharply to ~0.5 by index 5, then plateaus.
- **LRKV (r=64) (orange)**: Begins at ~8.5, declines to ~0.5 by index 5, then stabilizes.
- **GQA (green)**: Starts at ~6, decreases to ~0.5 by index 5, then flattens.
- **MQA (red)**: Peaks at ~10, drops to ~0.5 by index 5, then remains flat.
- **MLA (purple)**: Starts at ~8, declines to ~0.5 by index 5, then stabilizes.
#### Middle Layer (L=18)
- **Standard MHA (blue)**: Begins at ~3.5, drops to ~1.0 by index 5, then plateaus.
- **LRKV (r=64) (orange)**: Starts at ~1.2, declines to ~0.8 by index 5, then stabilizes.
- **GQA (green)**: Begins at ~1.5, decreases to ~0.8 by index 5, then flattens.
- **MQA (red)**: Peaks at ~3.5, drops to ~0.8 by index 5, then remains flat.
- **MLA (purple)**: Starts at ~2.5, declines to ~1.0 by index 5, then stabilizes.
#### Late Layer (L=35)
- **Standard MHA (blue)**: Begins at ~1.8, drops to ~0.8 by index 5, then plateaus.
- **LRKV (r=64) (orange)**: Starts at ~1.0, declines to ~0.8 by index 5, then stabilizes.
- **GQA (green)**: Begins at ~1.6, decreases to ~0.8 by index 5, then flattens.
- **MQA (red)**: Peaks at ~1.6, drops to ~0.8 by index 5, then remains flat.
- **MLA (purple)**: Starts at ~1.4, declines to ~0.8 by index 5, then stabilizes.
---
### Key Observations
1. **Sharp Initial Drop**: All methods exhibit a steep decline in eigenvalues at the first few indices (2.5–5), followed by gradual flattening.
2. **Layer-Specific Trends**:
- **Early Layer**: Highest eigenvalues (~10), indicating greater similarity variability.
- **Middle Layer**: Moderate eigenvalues (~3.5), showing reduced variability.
- **Late Layer**: Lowest eigenvalues (~1.8), suggesting stabilized similarity.
3. **Method Comparisons**:
- **Standard MHA** and **MQA** consistently start with the highest eigenvalues but drop sharply.
- **LRKV (r=64)** and **MLA** show more gradual declines, maintaining higher eigenvalues longer.
- **GQA** exhibits intermediate behavior, with eigenvalues decreasing steadily across layers.
---
### Interpretation
The eigenvalue spectra reveal how head similarity matrices evolve across transformer layers. Higher eigenvalues in early layers suggest greater diversity in attention head behavior, which diminishes as layers progress. Methods like **Standard MHA** and **MQA** aggressively reduce similarity early, potentially prioritizing distinct feature extraction. In contrast, **LRKV (r=64)** and **MLA** retain higher eigenvalues longer, possibly preserving more nuanced relationships. The Late Layer’s convergence across methods implies stabilized attention patterns, critical for final representations. These trends highlight trade-offs between diversity and stability in attention mechanisms, with implications for model efficiency and performance.