## Heatmap: QFilter Performance by Context Length and Depth Percent
### Overview
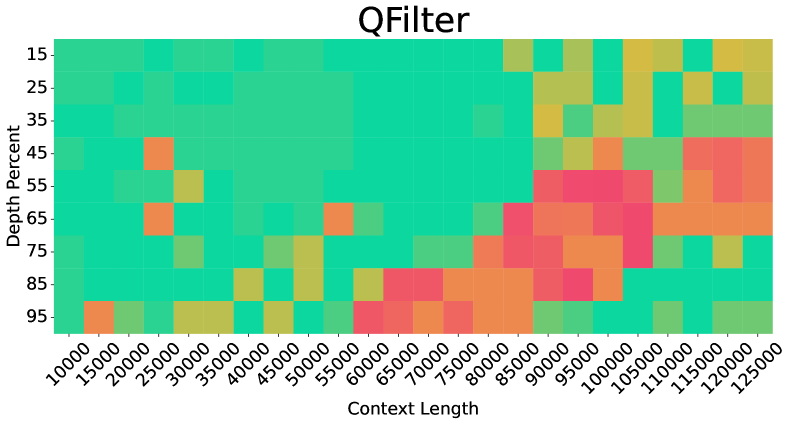
The image is a heatmap titled "QFilter," visualizing performance metrics across two dimensions: **Context Length** (x-axis) and **Depth Percent** (y-axis). Cells are color-coded to represent values, with a legend indicating a gradient from green (low) to red (high). The heatmap reveals spatial patterns of performance intensity.
---
### Components/Axes
- **X-Axis (Context Length)**:
- Labels: `10,000`, `15,000`, `20,000`, ..., `125,000` (increments of 5,000).
- Scale: Logarithmic-like progression, with denser clustering at lower values.
- **Y-Axis (Depth Percent)**:
- Labels: `15%`, `25%`, `35%`, ..., `95%` (increments of 10%).
- Scale: Linear from 15% to 95%.
- **Legend**:
- Position: Right of the heatmap.
- Colors:
- Green → Yellow → Orange → Red (low to high values).
- No explicit numerical scale provided; inferred from color intensity.
---
### Detailed Analysis
- **Color Distribution**:
- **Low Values (Green/Yellow)**: Dominant in lower-left quadrant (small context lengths, low depth percent).
- **Medium Values (Yellow/Orange)**: Clustered around mid-range context lengths (40k–80k) and mid-depth (45%–65%).
- **High Values (Red/Orange-Red)**: Concentrated in the upper-right quadrant (context lengths >80k, depth percent >65%).
- **Notable Patterns**:
- **Peaks**:
- Red cells at `95%` depth and `100k`–`125k` context lengths.
- Orange cells at `85%` depth and `90k`–`110k` context lengths.
- **Anomalies**:
- A red cell at `25k` context length and `45%` depth, suggesting an outlier.
- Sparse red/orange cells at `15k`–`30k` context lengths, indicating rare high-performance cases.
---
### Key Observations
1. **Positive Correlation**:
- Higher context lengths and depth percent generally align with increased performance (red/orange dominance in upper-right).
2. **Threshold Effects**:
- Performance plateaus at ~`95%` depth percent, regardless of context length.
3. **Efficiency Gaps**:
- Lower context lengths (<`50k`) show minimal high-performance regions, suggesting diminishing returns at small scales.
---
### Interpretation
The heatmap demonstrates that **QFilter's effectiveness scales with both context length and depth percent**, with the strongest performance observed at large context lengths (>`100k`) and high depth percent (>`85%`). The outlier at `25k` context and `45%` depth suggests exceptional cases where performance spikes despite suboptimal parameters. The plateau at `95%` depth implies diminishing returns beyond this threshold.
**Implications**:
- Prioritize longer contexts and higher depth for optimal QFilter performance.
- Investigate anomalies (e.g., `25k`/`45%`) to identify unique use cases or data characteristics.
- The absence of a clear numerical scale in the legend limits precise quantification but highlights relative trends.