\n
## Bar Chart: Estimated Annotation Cost Comparison
### Overview
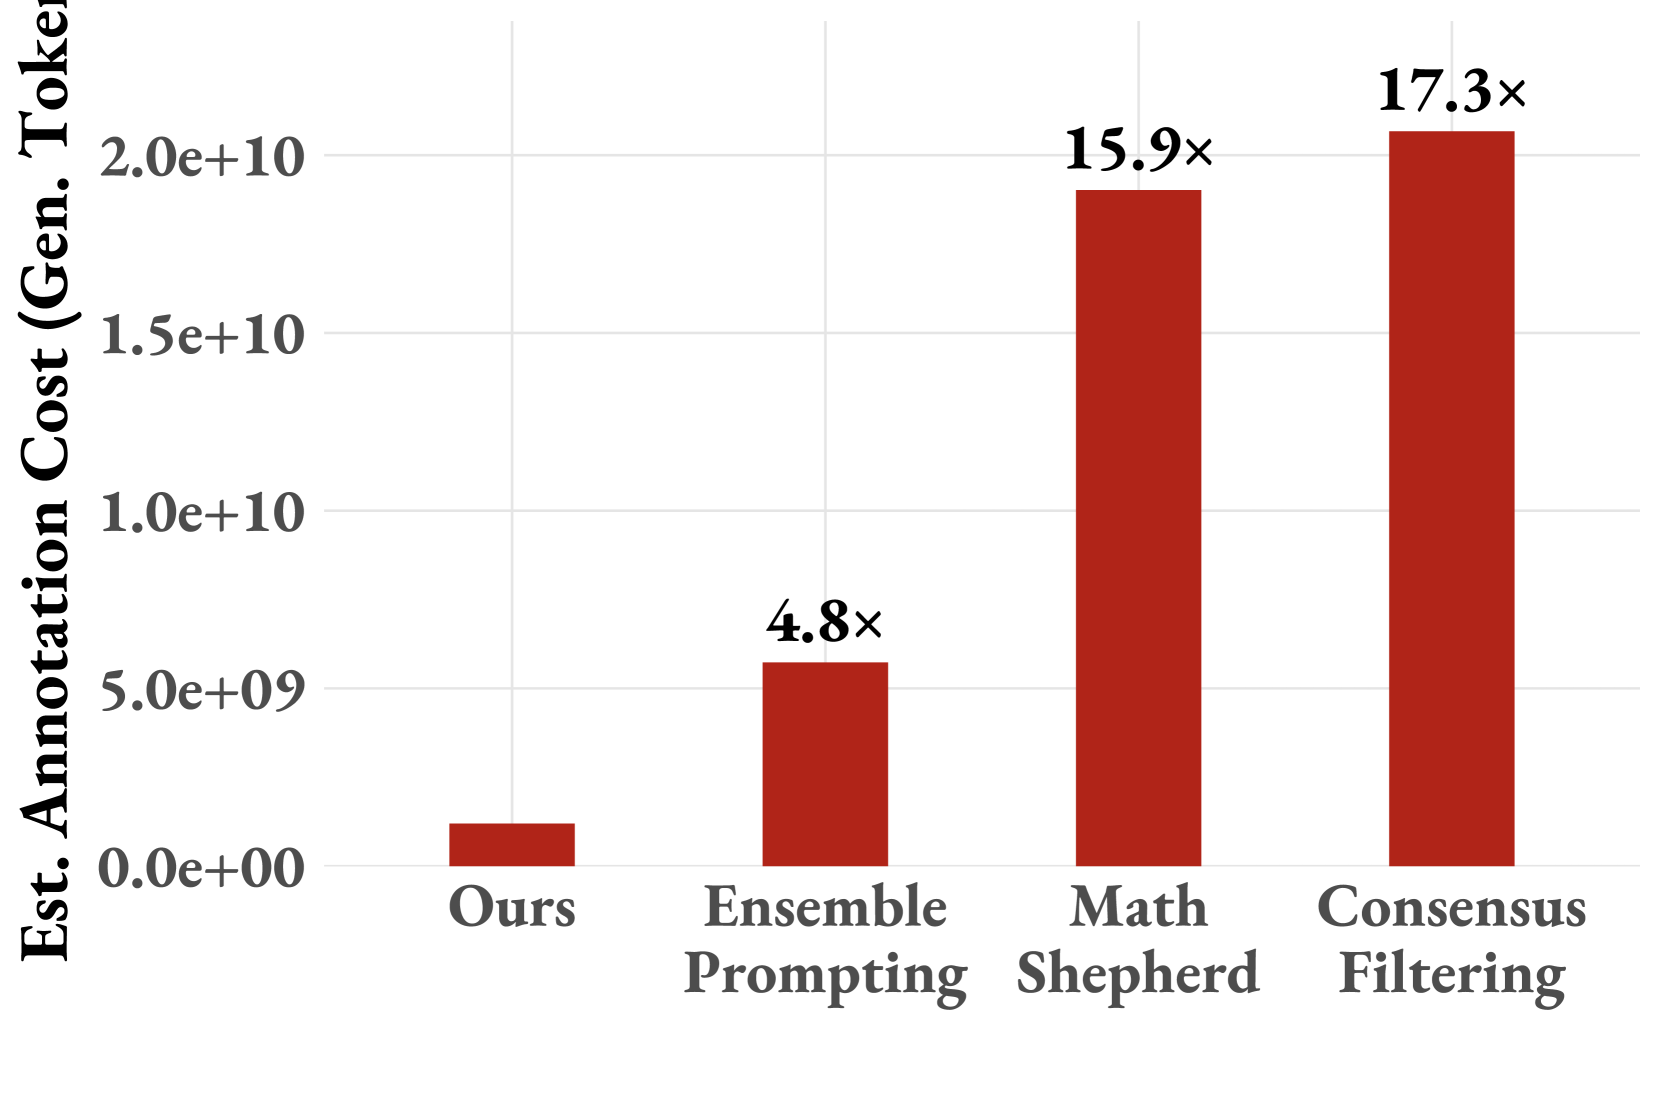
This image presents a bar chart comparing the estimated annotation cost (in generated tokens) for four different methods: "Ours", "Ensemble Prompting", "Math Shepherd", and "Consensus Filtering". The cost is represented on the y-axis, while the methods are displayed on the x-axis. Each bar is labeled with a multiplier indicating the relative cost compared to the "Ours" method.
### Components/Axes
* **X-axis:** Methods - "Ours", "Ensemble Prompting", "Math Shepherd", "Consensus Filtering".
* **Y-axis:** Est. Annotation Cost (Gen. Tokens) - Scale ranges from 0.0e+00 to 2.0e+10.
* **Bars:** Represent the estimated annotation cost for each method.
* **Labels:** Each bar is labeled with a multiplier (e.g., "4.8x", "15.9x", "17.3x") indicating the cost relative to the "Ours" method.
### Detailed Analysis
The bar chart displays the following approximate values:
* **Ours:** The bar is very short, positioned near the bottom of the y-axis. The estimated annotation cost is approximately 2.0e+08 tokens.
* **Ensemble Prompting:** The bar is significantly taller than "Ours". The estimated annotation cost is approximately 4.8 times that of "Ours", or roughly 9.6e+08 tokens (2.0e+08 * 4.8).
* **Math Shepherd:** The bar is much taller than "Ensemble Prompting". The estimated annotation cost is approximately 15.9 times that of "Ours", or roughly 3.2e+09 tokens (2.0e+08 * 15.9).
* **Consensus Filtering:** The tallest bar, indicating the highest estimated annotation cost. The estimated annotation cost is approximately 17.3 times that of "Ours", or roughly 3.5e+09 tokens (2.0e+08 * 17.3).
The bars are arranged horizontally, with "Ours" on the left and "Consensus Filtering" on the right. The y-axis is in scientific notation.
### Key Observations
* The "Ours" method has the lowest estimated annotation cost by a substantial margin.
* "Consensus Filtering" and "Math Shepherd" have significantly higher annotation costs compared to "Ours" and "Ensemble Prompting".
* The annotation cost increases dramatically as you move from "Ours" to "Ensemble Prompting", and then continues to increase with "Math Shepherd" and "Consensus Filtering".
* The difference in cost between "Math Shepherd" and "Consensus Filtering" is relatively small.
### Interpretation
The data suggests that the "Ours" method is the most cost-effective in terms of annotation effort (measured in generated tokens). The other methods, particularly "Consensus Filtering" and "Math Shepherd", require significantly more annotation, potentially due to the complexity of the process or the need for more extensive validation. The multipliers provide a clear indication of the relative cost burden associated with each method.
The chart implies a trade-off between annotation cost and potentially the quality or reliability of the results. While "Ours" is the cheapest, it's unclear from this chart whether it achieves comparable performance to the more expensive methods. The chart focuses solely on the annotation cost, and doesn't provide information about the accuracy, precision, or other relevant metrics of each method.
The use of multipliers is effective in highlighting the relative differences in cost. The large differences in multipliers (4.8x, 15.9x, 17.3x) emphasize the substantial cost implications of choosing one method over another.