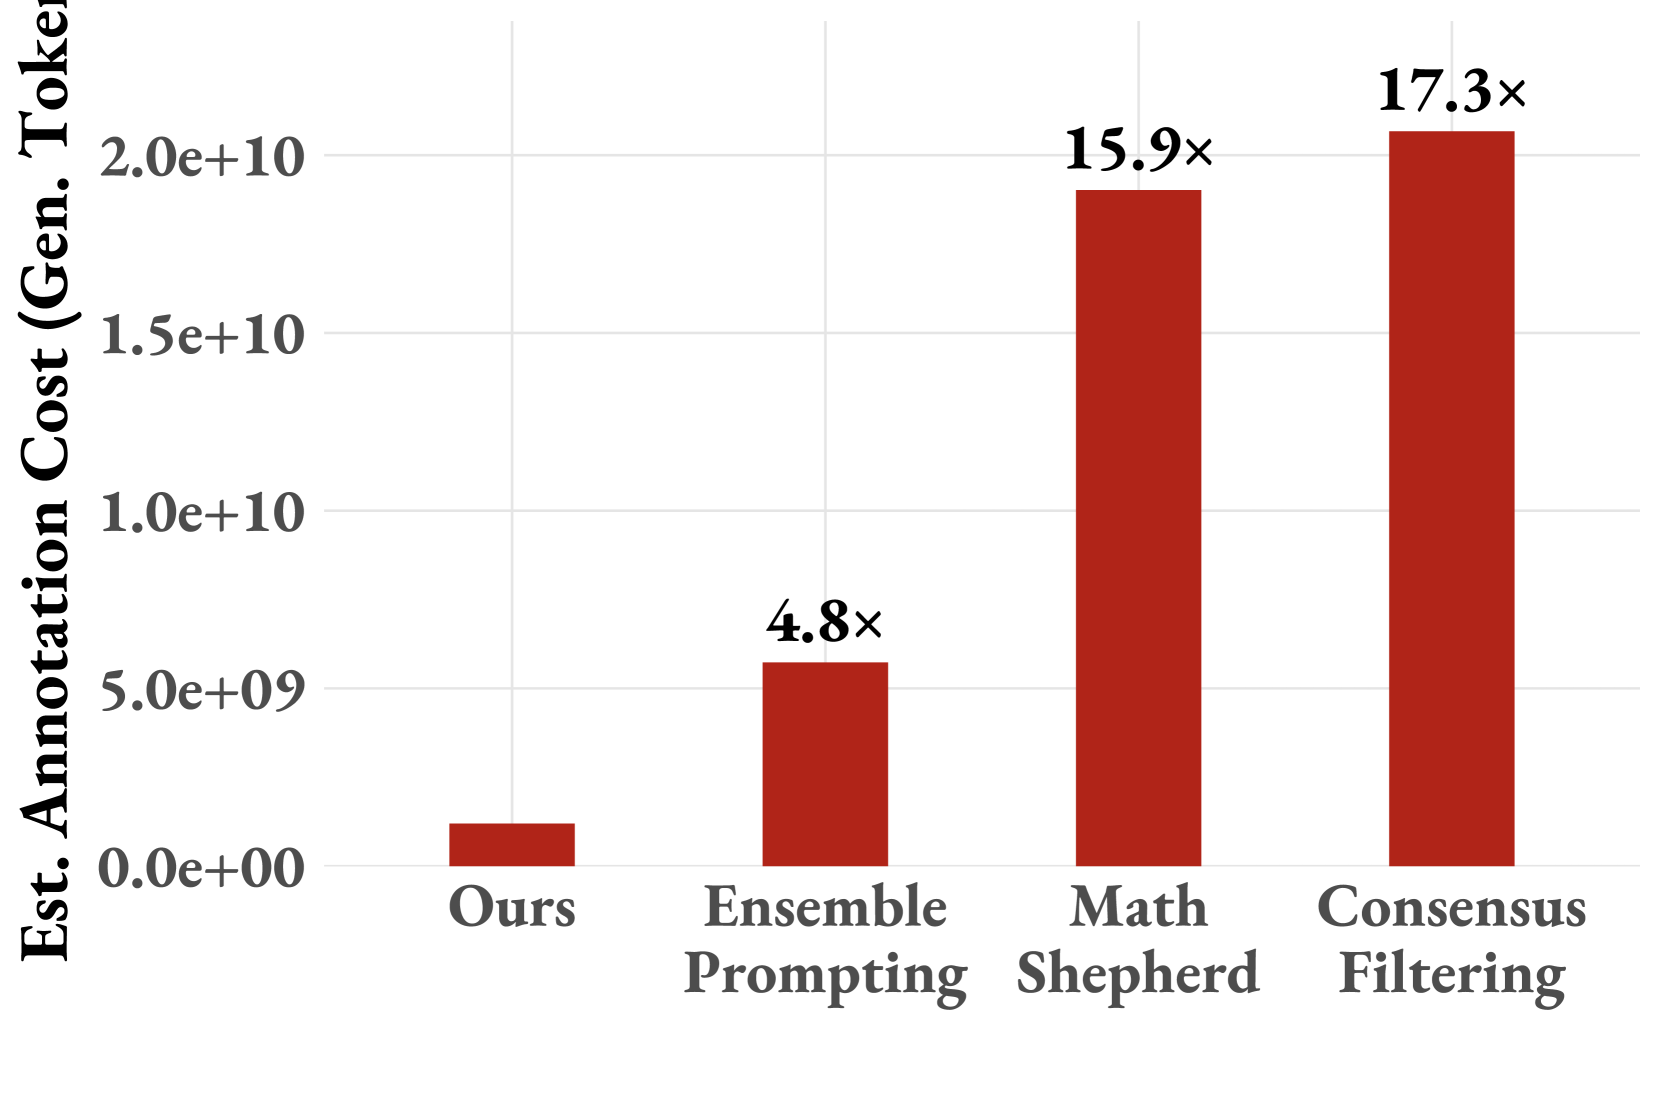
## Bar Chart: Estimated Annotation Cost Comparison
### Overview
The image is a bar chart comparing the estimated annotation costs (in "Gen. Token") for four different methods: "Ours," "Ensemble Prompting," "Math Shepherd," and "Consensus Filtering." The y-axis represents the cost in scientific notation (e.g., 1.0e+10), while the x-axis lists the methods. Each bar is labeled with a multiplier (e.g., "1x," "4.8x") indicating the relative cost compared to a baseline.
### Components/Axes
- **X-axis**: Labeled "Methods" with categories: "Ours," "Ensemble Prompting," "Math Shepherd," "Consensus Filtering."
- **Y-axis**: Labeled "Est. Annotation Cost (Gen. Token)" with values: 0.0e+00, 5.0e+09, 1.0e+10, 1.5e+10, 2.0e+10.
- **Bars**: Red-colored bars with multipliers (e.g., "1x," "4.8x") displayed above each bar.
- **No legend** is present in the image.
### Detailed Analysis
- **"Ours"**: The shortest bar, with a multiplier of **1x** (baseline). Its height corresponds to approximately **1.0e+10** on the y-axis.
- **"Ensemble Prompting"**: A bar with a multiplier of **4.8x**, reaching approximately **4.8e+10** (though the y-axis only goes up to 2.0e+10, suggesting the bar may extend beyond the chart's visible range).
- **"Math Shepherd"**: A bar with a multiplier of **15.9x**, reaching approximately **1.59e+11** (again, exceeding the chart's visible y-axis range).
- **"Consensus Filtering"**: The tallest bar, with a multiplier of **17.3x**, reaching approximately **1.73e+11** (also exceeding the chart's visible y-axis range).
### Key Observations
1. **"Ours"** is the most cost-effective method, with a multiplier of **1x** (baseline).
2. **"Ensemble Prompting"** is **4.8x** more expensive than "Ours."
3. **"Math Shepherd"** and **"Consensus Filtering"** are significantly more expensive, with multipliers of **15.9x** and **17.3x**, respectively.
4. The y-axis scale (up to 2.0e+10) does not fully capture the higher values for "Math Shepherd" and "Consensus Filtering," indicating the chart may be truncated or scaled incompletely.
### Interpretation
The data suggests a clear hierarchy in annotation costs:
- **"Ours"** is the most efficient, requiring the least resources.
- **"Ensemble Prompting"** introduces a moderate cost increase.
- **"Math Shepherd"** and **"Consensus Filtering"** are the most resource-intensive, with costs escalating exponentially.
- The chart’s y-axis may not fully represent the higher values for the latter two methods, potentially obscuring the true scale of their costs.
- The multipliers imply that the methods vary widely in efficiency, with "Consensus Filtering" being the least efficient.
This analysis highlights the trade-offs between different annotation strategies, emphasizing the need for cost-aware method selection in resource-constrained environments.