## Diagram: System Interaction Model
### Overview
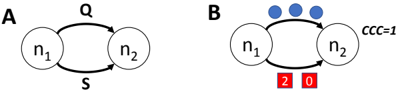
The image contains two side-by-side diagrams (A and B) depicting a system with two nodes (`n₁` and `n₂`) connected by a bidirectional arrow labeled `Q`. Diagram B includes additional annotations (dots, squares, and labels) not present in Diagram A.
### Components/Axes
- **Nodes**:
- `n₁` (left circle) and `n₂` (right circle) in both diagrams.
- **Arrows**:
- Bidirectional arrow labeled `Q` connecting `n₁` and `n₂` in both diagrams.
- **Diagram A Specific**:
- Label `S` positioned below the `Q` arrow.
- **Diagram B Specific**:
- Three blue dots above the `Q` arrow, labeled `CCC=1`.
- Two red squares below the `Q` arrow, labeled `2` and `0`.
### Detailed Analysis
- **Diagram A**:
- Minimalist representation of a system with two nodes (`n₁`, `n₂`) and a bidirectional interaction (`Q`).
- `S` likely represents a state, variable, or process associated with the interaction.
- **Diagram B**:
- **Blue Dots (`CCC=1`)**: Three dots above the `Q` arrow, possibly indicating a count or category (e.g., "CCC" as a metric or classification).
- **Red Squares (`2`, `0`)**: Positioned below the `Q` arrow, these could represent binary states (e.g., active/inactive) or counts (e.g., "2" active instances, "0" inactive).
### Key Observations
1. **Structural Similarity**: Both diagrams share the core structure of `n₁` ↔ `Q` ↔ `n₂`, suggesting a foundational relationship.
2. **Diagram B Annotations**:
- `CCC=1` and the three blue dots imply a quantifiable or categorical attribute tied to the interaction.
- The red squares (`2`, `0`) introduce binary or discrete states, contrasting with the continuous interaction in Diagram A.
3. **Positioning**:
- In Diagram B, annotations (`CCC=1`, `2`, `0`) are spatially separated from the core nodes, suggesting they are secondary or contextual to the primary interaction (`Q`).
### Interpretation
- **System Dynamics**:
- Diagram A represents a basic bidirectional relationship (`Q`) between two nodes, with `S` as a modifier or state.
- Diagram B expands this model by introducing **quantitative** (`CCC=1`) and **binary** (`2`, `0`) parameters, possibly reflecting real-world constraints or operational states.
- **Potential Use Cases**:
- The diagrams could model processes like data flow (`Q`), state transitions (`S`), or resource allocation (`CCC=1`, `2`, `0`).
- The red squares (`2`, `0`) might indicate thresholds (e.g., "2" active nodes, "0" failures) or binary flags for system health.
- **Anomalies**:
- The absence of a legend for the blue dots and red squares in Diagram B leaves their exact meaning ambiguous. However, their placement suggests they are directly tied to the `Q` interaction.
### Conclusion
The diagrams illustrate a hierarchical system where core interactions (`Q`) are modified by additional parameters (`S`, `CCC=1`, `2`, `0`). Diagram B’s annotations likely represent measurable or categorical extensions of the base model in Diagram A, emphasizing the system’s adaptability to external conditions or states.