## Diagram: EpMAN Model Workflow
### Overview
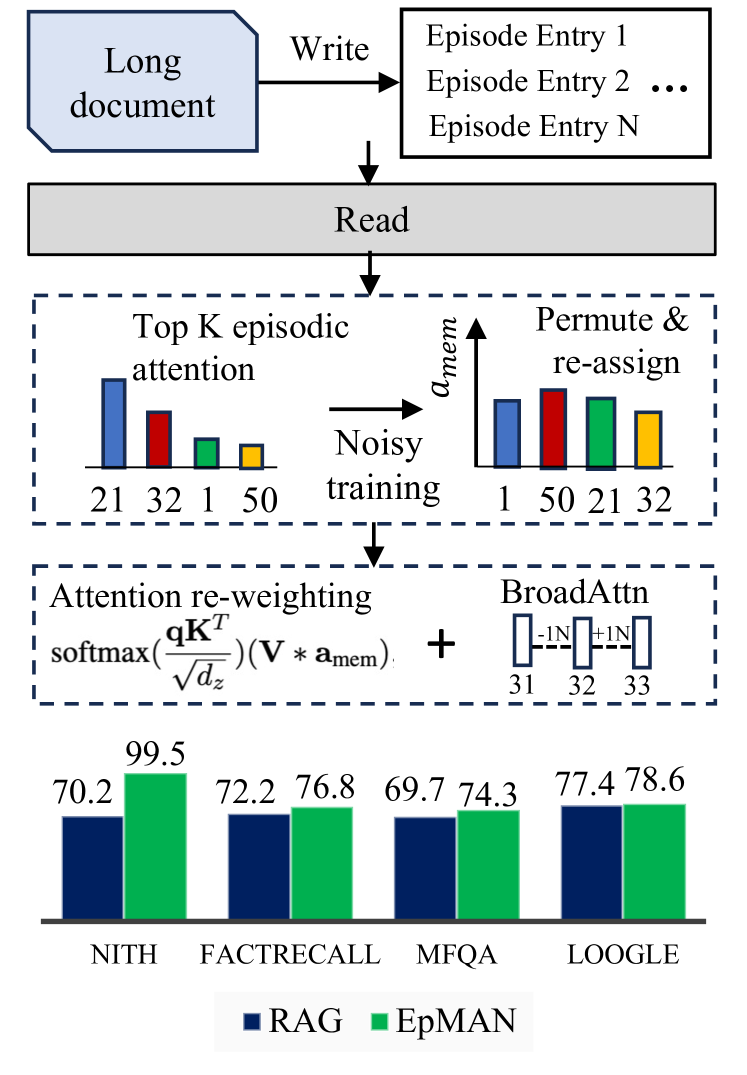
The image illustrates the workflow of the EpMAN (Episodic Memory Augmented Network) model. It shows the process of writing and reading from a long document, episodic attention mechanisms, and the final performance evaluation of the model against several benchmarks.
### Components/Axes
* **Top**: A light blue rounded rectangle labeled "Long document" with an arrow pointing to a set of episode entries. The arrow is labeled "Write".
* **Middle**: A gray rectangle labeled "Read" with an arrow pointing downwards.
* **Episodic Attention Block**: A dashed rectangle containing the episodic attention mechanism.
* "Top K episodic attention": A bar chart showing attention scores for episodes 21, 32, 1, and 50. The bar heights are approximately 75%, 50%, 25%, and 20% respectively.
* "Noisy training": An arrow pointing from the "Top K episodic attention" to "Permute & re-assign".
* "Permute & re-assign": A bar chart showing permuted attention scores for episodes 1, 50, 21, and 32. The bar heights are approximately 30%, 70%, 60%, and 40% respectively.
* Vertical axis label: "a_mem"
* **Attention Re-weighting Block**: A dashed rectangle containing the attention re-weighting mechanism.
* "Attention re-weighting": The formula "softmax(qK^T / sqrt(dz)) * (V * a_mem)"
* "+" symbol
* "BroadAttn": A diagram showing connections between nodes 31, 32, and 33, with weights -1, 0, and +1 respectively.
* **Bottom**: A bar chart comparing the performance of RAG (blue bars) and EpMAN (green bars) on different benchmarks.
* X-axis labels: NITH, FACTRECALL, MFQA, LOOGLE
* Y-axis: Implicitly represents performance metric (likely accuracy or F1-score)
* Legend:
* Blue: RAG
* Green: EpMAN
### Detailed Analysis
* **Top K episodic attention**:
* Episode 21: Attention score ~75%
* Episode 32: Attention score ~50%
* Episode 1: Attention score ~25%
* Episode 50: Attention score ~20%
* **Permute & re-assign**:
* Episode 1: Attention score ~30%
* Episode 50: Attention score ~70%
* Episode 21: Attention score ~60%
* Episode 32: Attention score ~40%
* **Performance Bar Chart**:
* NITH: RAG = 70.2, EpMAN = 99.5
* FACTRECALL: RAG = 72.2, EpMAN = 76.8
* MFQA: RAG = 69.7, EpMAN = 74.3
* LOOGLE: RAG = 77.4, EpMAN = 78.6
### Key Observations
* The EpMAN model consistently outperforms the RAG model across all benchmarks.
* The most significant performance difference is observed on the NITH benchmark.
* The episodic attention mechanism involves selecting the top K episodes and then permuting and re-assigning their attention scores during noisy training.
### Interpretation
The diagram illustrates the architecture and workflow of the EpMAN model, highlighting its episodic attention mechanism and performance improvements over the RAG model. The model first writes information from a long document into episodic memory. Then, it reads from this memory, focusing on the top K episodes based on attention scores. The noisy training process, involving permutation and re-assignment of attention scores, likely helps the model to generalize better and avoid overfitting. The final performance evaluation shows that EpMAN consistently outperforms RAG, particularly on the NITH benchmark, suggesting that the episodic attention mechanism is effective in improving the model's performance. The BroadAttn component likely represents a broader attention mechanism that complements the episodic attention.