# Technical Document Extraction: Diagram Analysis
## Diagram Overview
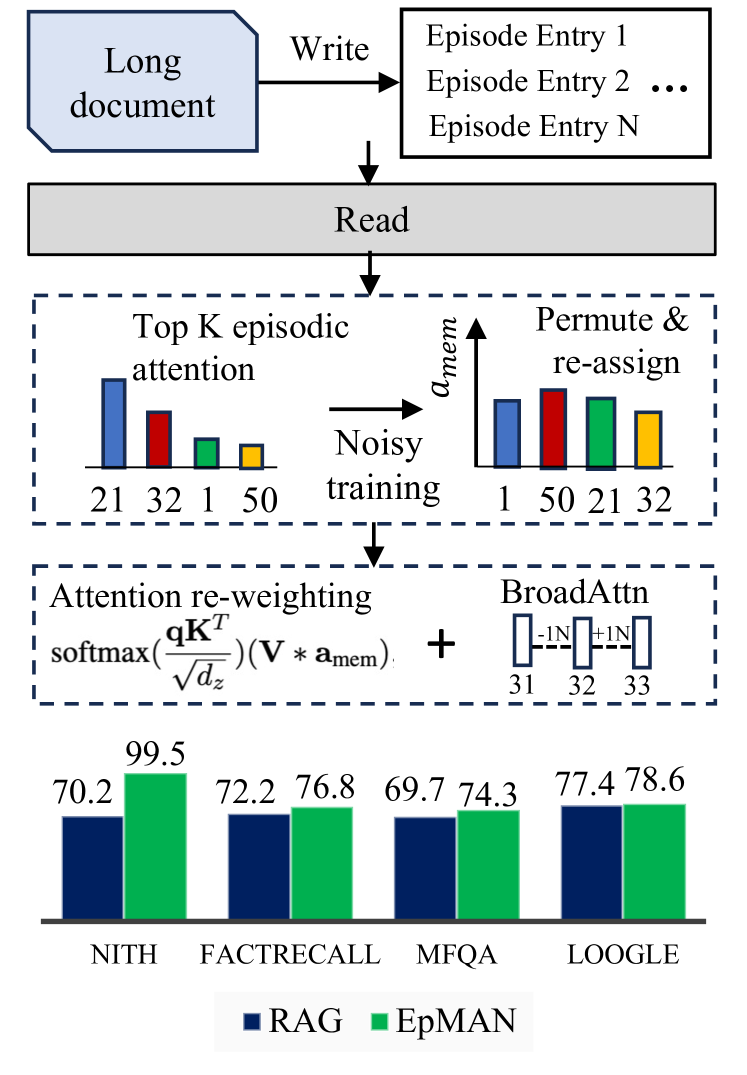
The image presents a technical workflow diagram with two primary components:
1. A process flow diagram (top half)
2. A comparative performance chart (bottom half)
---
## Process Flow Diagram (Top Half)
### Components and Flow
1. **Input/Output Section**
- **Input**: "Long document" (blue box)
- **Process**: "Write" arrow
- **Output**: Multiple "Episode Entry" boxes (1 to N)
2. **Read Operation**
- Central gray rectangle labeled "Read"
- Downward arrow connecting to attention mechanism
3. **Attention Mechanism**
- **Top K Episodic Attention**:
- Bar chart with values: 21 (blue), 32 (red), 1 (green), 50 (yellow)
- Dashed blue box containing this component
- **Noisy Training**:
- Arrow labeled `a_mem` pointing to "Permute & re-assign"
- Bar chart showing reordered values: 1 (blue), 50 (red), 21 (green), 32 (yellow)
4. **Attention Re-weighting**
- Formula: `softmax(qK^T / √dz)(V * a_mem)`
- **BroadAttn**:
- Dashed box with sequence: -1N, +1N, 31, 32, 33
---
## Performance Comparison Chart (Bottom Half)
### Axes and Labels
- **X-axis**: Datasets
- NITH, FACTRECALL, MFQA, LOOGLE
- **Y-axis**: Performance percentages (0-100% scale)
- **Legend**:
- Blue = RAG
- Green = EpMAN
### Data Points
| Dataset | RAG (%) | EpMAN (%) |
|--------------|---------|-----------|
| NITH | 70.2 | 99.5 |
| FACTRECALL | 72.2 | 76.8 |
| MFQA | 69.7 | 74.3 |
| LOOGLE | 77.4 | 78.6 |
---
## Key Observations
1. **Process Flow Logic**
- Documents are written into episodic entries
- Read operation triggers attention mechanism
- Attention values are reordered through noisy training
- Re-weighted attention combines with broad attention
2. **Performance Trends**
- **EpMAN** consistently outperforms RAG across all datasets
- Largest margin in NITH (29.3% difference)
- Smallest difference in LOOGLE (1.2% difference)
- RAG shows slight improvement from MFQA to LOOGLE (+7.7%)
3. **Attention Mechanism Behavior**
- Initial attention weights show high variability (1-50 range)
- Post-reassignment shows more balanced distribution (1-50 range maintained)
---
## Spatial Grounding
- Legend position: Bottom center
- Color coding:
- Blue (#003f5c) = RAG
- Green (#4575b4) = EpMAN
- All bar colors in performance chart match legend exactly
---
## Transcribed Formulas
1. Attention re-weighting formula:
`softmax(qK^T / √dz)(V * a_mem)`
2. Broad attention sequence:
`-1N, +1N, 31, 32, 33`
---
## Language Notes
- All text appears in English
- No non-English content detected