## Line Chart: Test Accuracy vs. Number of Feedback Rounds
### Overview
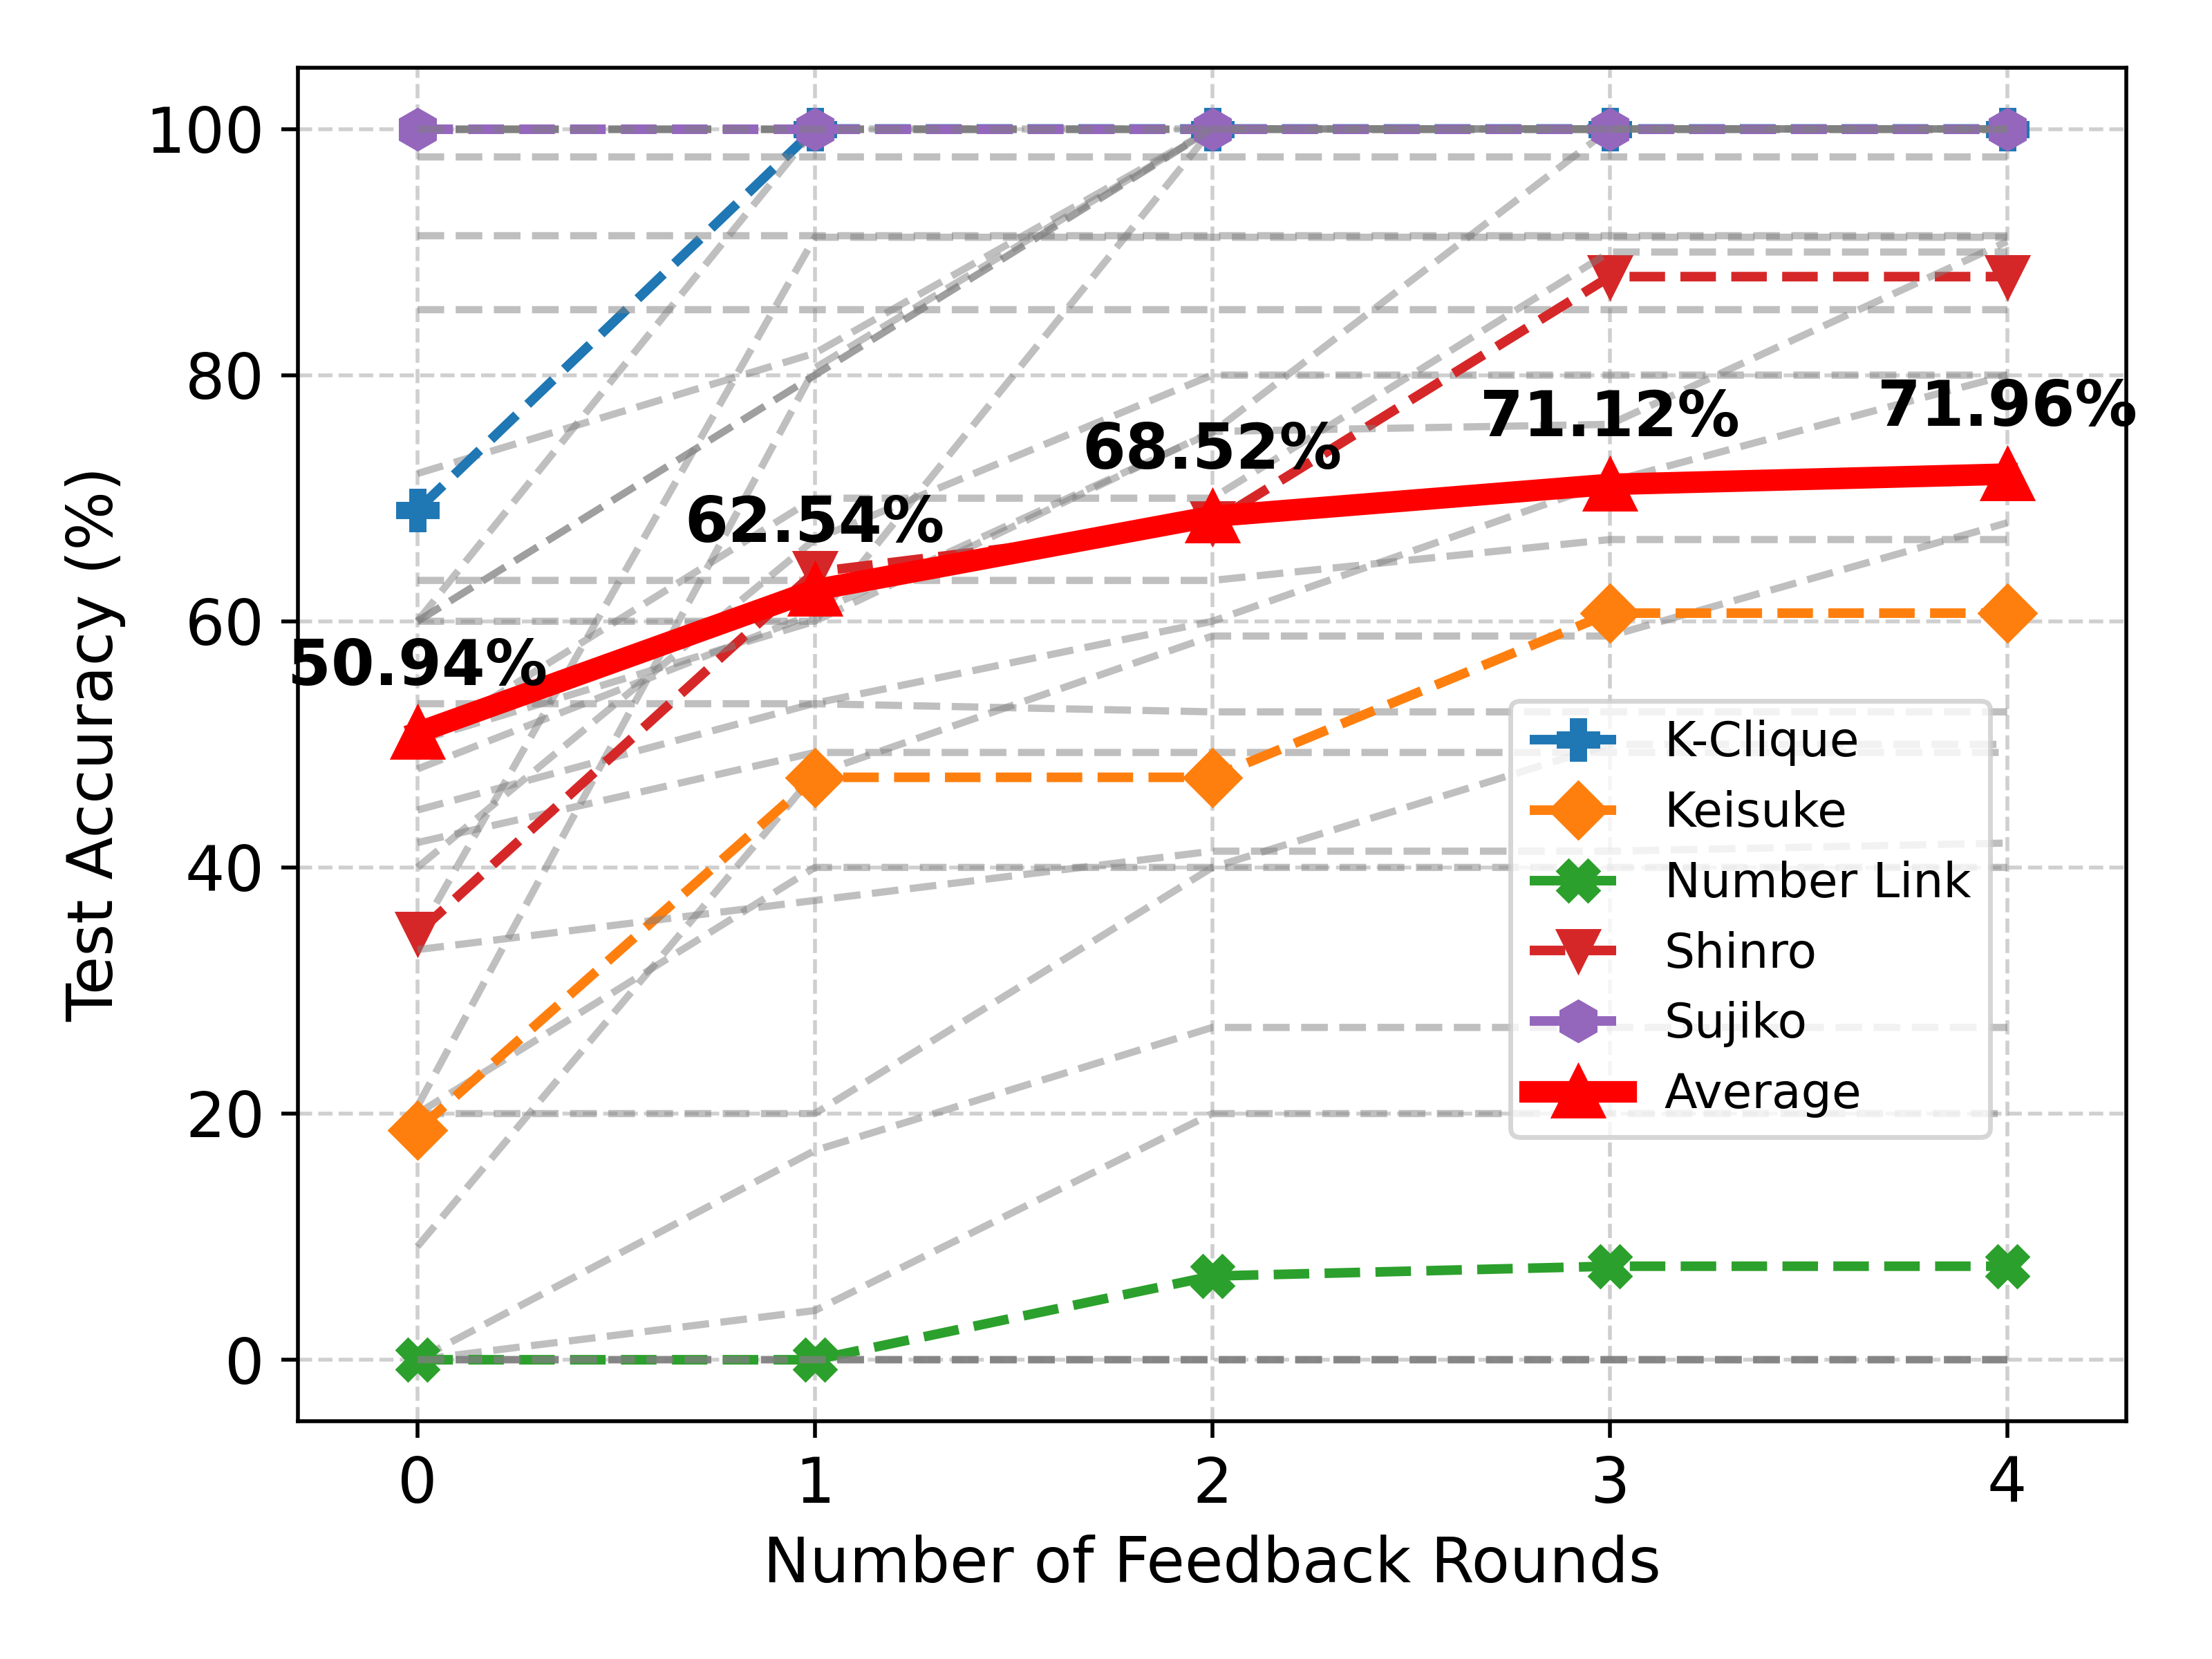
The image is a line chart comparing the test accuracy (%) of different methods (K-Clique, Keisuke, Number Link, Shinro, and Sujiko) against the number of feedback rounds (0 to 4). It also includes an average accuracy line. The chart uses dashed lines for each method and a solid, thicker line for the average.
### Components/Axes
* **X-axis:** Number of Feedback Rounds, with values 0, 1, 2, 3, and 4.
* **Y-axis:** Test Accuracy (%), with values ranging from 0 to 100. Gridlines are present at intervals of 20.
* **Legend:** Located in the bottom-right corner, it identifies each method by color and name:
* Blue: K-Clique
* Orange: Keisuke
* Green: Number Link
* Red: Shinro
* Purple: Sujiko
* Thick Red: Average
* **Data Series:** Each method's performance is represented by a dashed line with a specific color and marker. The average performance is represented by a thick solid red line with triangle markers.
### Detailed Analysis
**K-Clique (Blue, dashed line with plus markers):**
* Trend: Slopes upward from round 0 to round 1, then remains relatively constant.
* Round 0: Approximately 70%
* Round 1: Approximately 98%
* Round 2: Approximately 100%
* Round 3: Approximately 100%
* Round 4: Approximately 100%
**Keisuke (Orange, dashed line with diamond markers):**
* Trend: Slopes upward from round 0 to round 3, then remains relatively constant.
* Round 0: Approximately 18%
* Round 1: Approximately 48%
* Round 2: Approximately 48%
* Round 3: Approximately 60%
* Round 4: Approximately 60%
**Number Link (Green, dashed line with x markers):**
* Trend: Remains relatively constant at a low accuracy.
* Round 0: Approximately 0%
* Round 1: Approximately 0%
* Round 2: Approximately 7%
* Round 3: Approximately 7%
* Round 4: Approximately 7%
**Shinro (Red, dashed line with triangle markers):**
* Trend: Slopes upward from round 0 to round 3, then remains relatively constant.
* Round 0: Approximately 35%
* Round 1: Approximately 60%
* Round 2: Approximately 68%
* Round 3: Approximately 88%
* Round 4: Approximately 88%
**Sujiko (Purple, dashed line with pentagon markers):**
* Trend: Remains relatively constant at a high accuracy.
* Round 0: Approximately 100%
* Round 1: Approximately 100%
* Round 2: Approximately 100%
* Round 3: Approximately 100%
* Round 4: Approximately 100%
**Average (Thick Red, solid line with triangle markers):**
* Trend: Slopes upward from round 0 to round 4.
* Round 0: 50.94%
* Round 1: 62.54%
* Round 2: 68.52%
* Round 3: 71.12%
* Round 4: 71.96%
There are also several grey dashed lines that appear to connect the data points of the other lines.
### Key Observations
* Sujiko consistently achieves the highest test accuracy, remaining at 100% across all feedback rounds.
* Number Link consistently performs the worst, with accuracy remaining near 0%.
* K-Clique shows a significant improvement from round 0 to round 1, then plateaus.
* The average accuracy increases with the number of feedback rounds, but the rate of increase diminishes.
### Interpretation
The chart illustrates the impact of feedback rounds on the test accuracy of different methods. Sujiko's consistently high performance suggests it is the most robust method, while Number Link's consistently low performance indicates it may be ineffective. The increasing average accuracy suggests that, overall, feedback rounds improve performance, but the diminishing rate of increase implies that there may be a point of diminishing returns. The grey dashed lines are likely showing the individual data points that are being averaged.