## Line Chart: Test Accuracy vs. Number of Feedback Rounds
### Overview
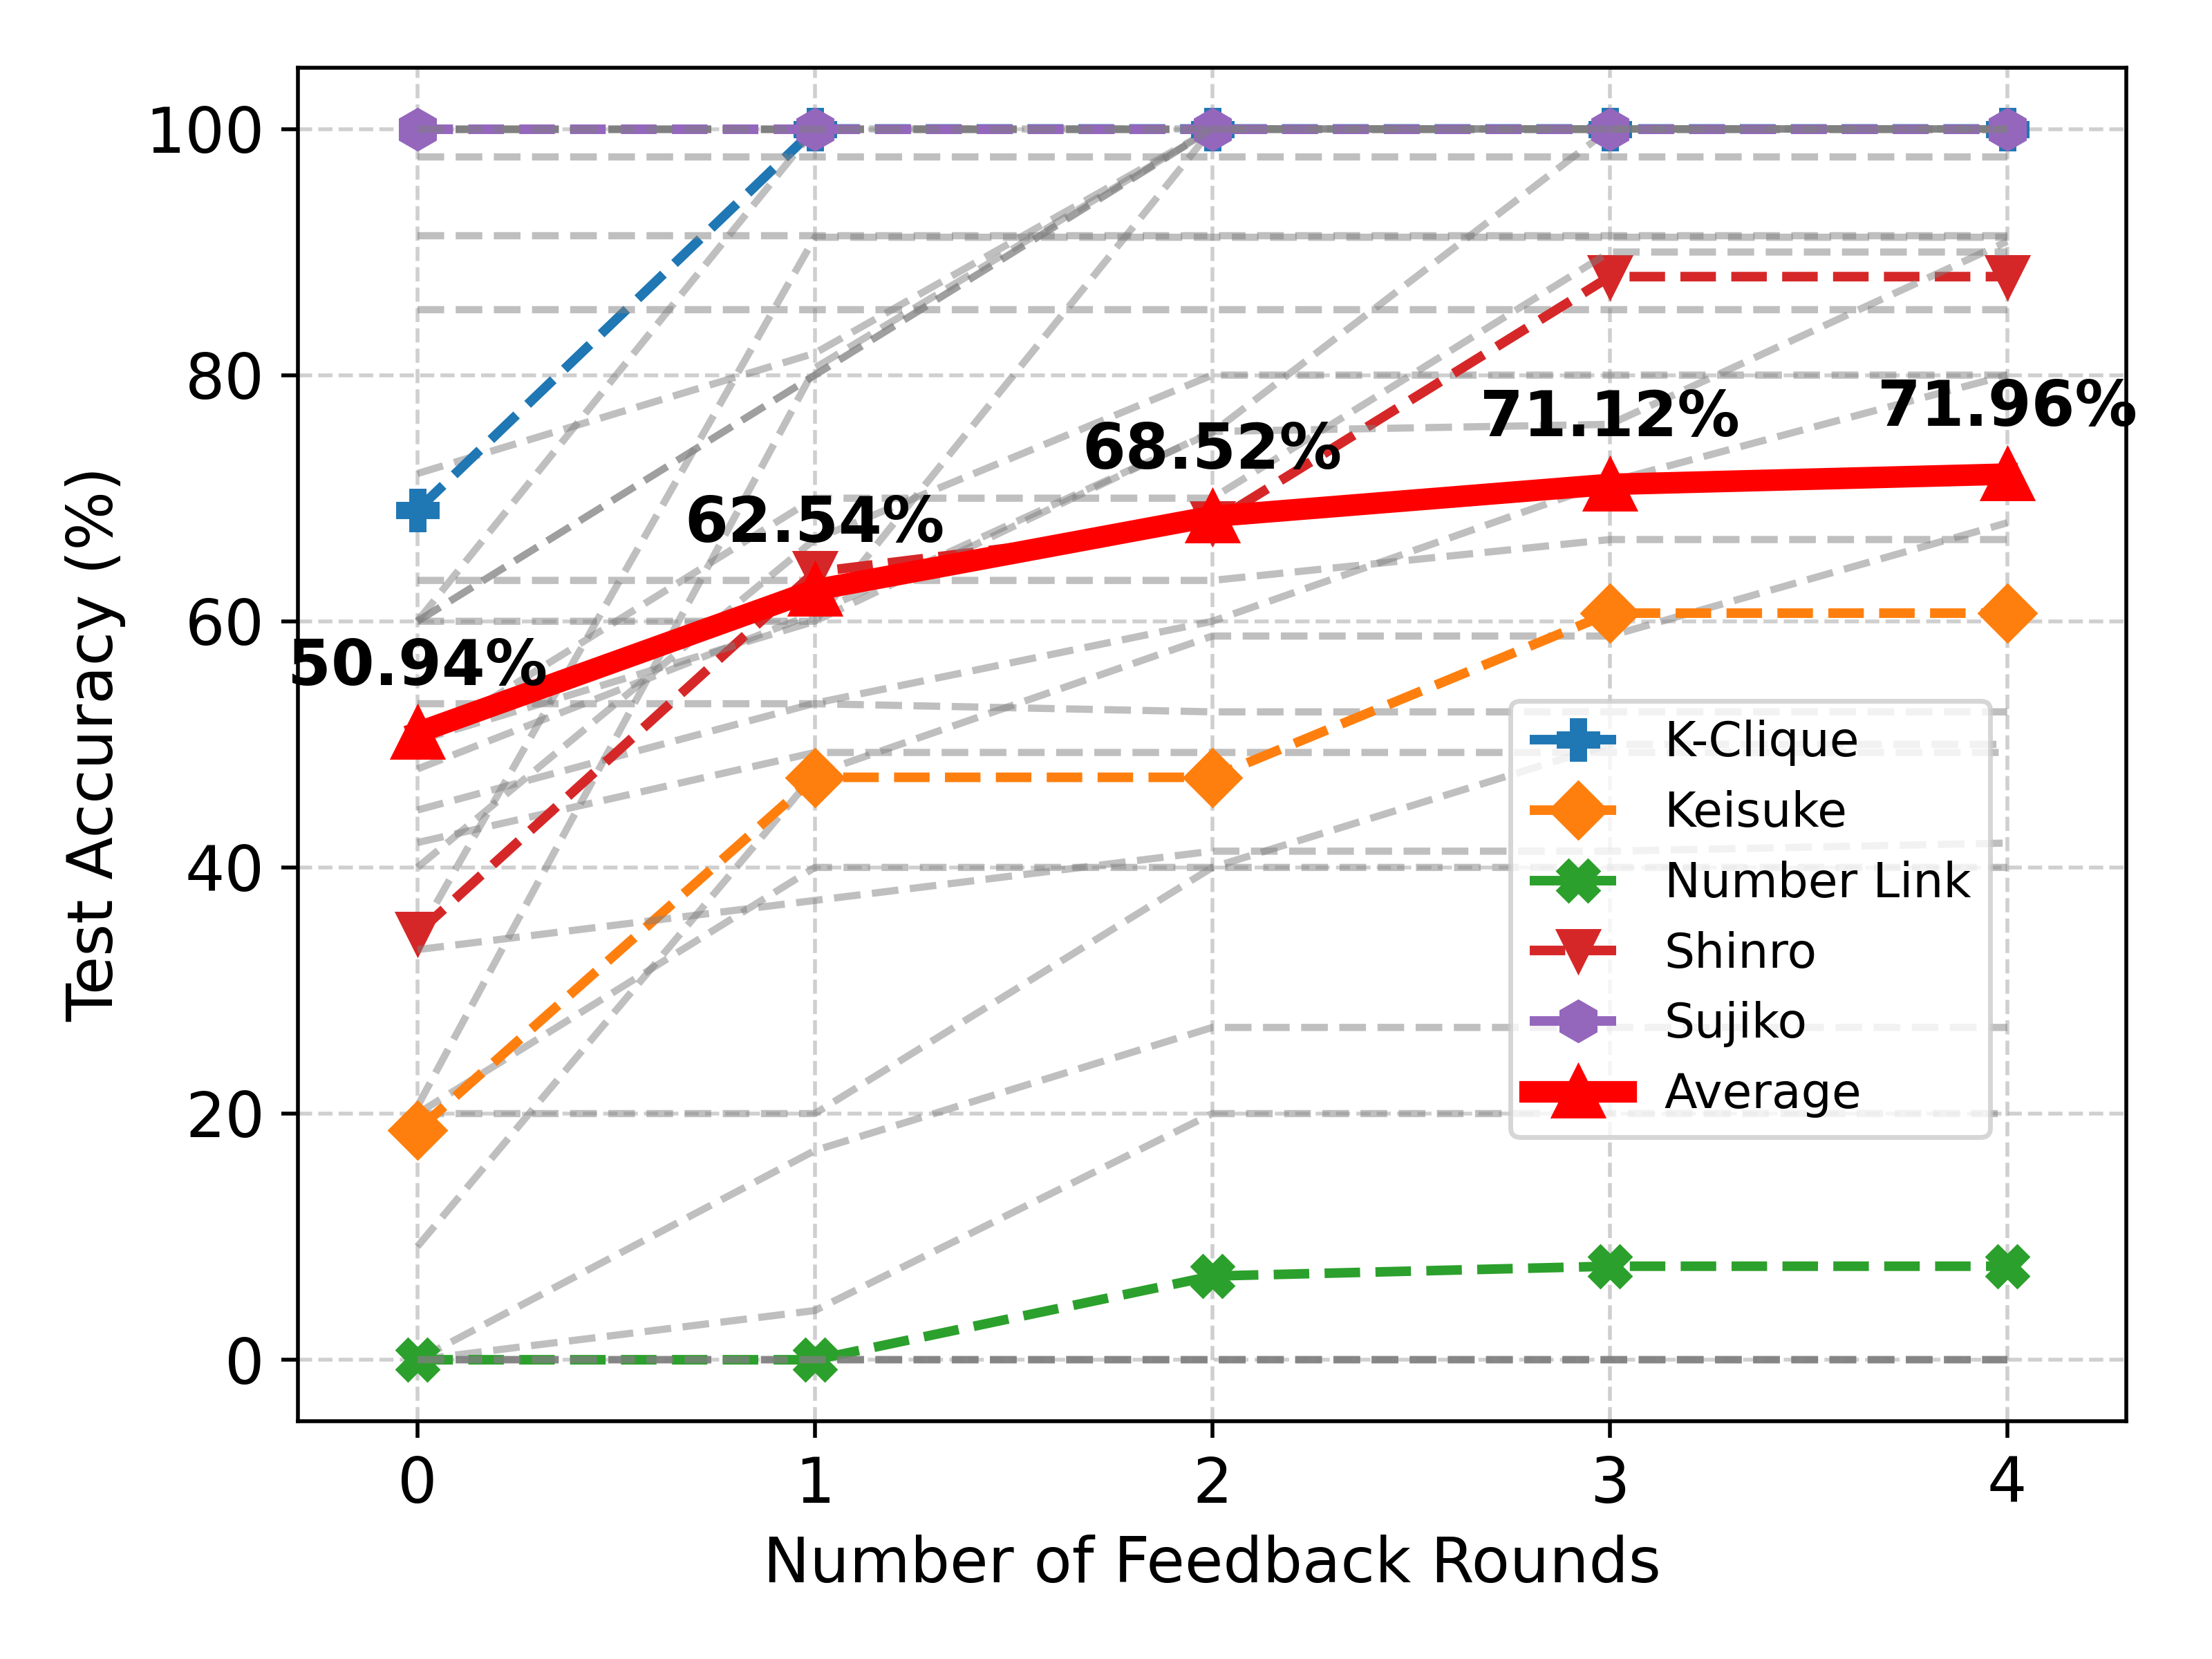
The chart displays test accuracy percentages across five methods (K-Clique, Keisuke, Number Link, Shinro, Sujiko) and an average line, plotted against the number of feedback rounds (0–4). The y-axis ranges from 0% to 100%, with gridlines at 20% intervals. The Average line (red) dominates the upper portion, while Number Link (green) remains near the bottom.
### Components/Axes
- **X-axis**: Number of Feedback Rounds (0, 1, 2, 3, 4)
- **Y-axis**: Test Accuracy (%) (0%, 20%, 40%, 60%, 80%, 100%)
- **Legend**: Located on the right, with color/symbol mappings:
- K-Clique: Blue cross (`+`)
- Keisuke: Orange diamond (`◇`)
- Number Link: Green cross (`✖️`)
- Shinro: Red dashed line with triangle (`▼`)
- Sujiko: Purple hexagon (`⬡`)
- Average: Red solid line with triangle (`▼`)
### Detailed Analysis
1. **Average Line (Red)**:
- Starts at **50.94%** (round 0), rising steadily to **71.96%** (round 4).
- Intermediate values: 62.54% (round 1), 68.52% (round 2), 71.12% (round 3).
2. **Sujiko (Purple)**:
- Flat line at **100%** across all rounds.
3. **K-Clique (Blue)**:
- Begins at **70%** (round 0), spikes to **100%** (round 1), then declines to **80%** (round 4).
- Intermediate values: 90% (round 2), 85% (round 3).
4. **Keisuke (Orange)**:
- Starts at **20%** (round 0), jumps to **50%** (round 1), plateaus at **50%** (round 2), then rises to **60%** (rounds 3–4).
5. **Number Link (Green)**:
- Starts at **0%** (rounds 0–1), increases to **7%** (round 2), **8%** (rounds 3–4).
6. **Shinro (Red Dashed)**:
- Begins at **35%** (round 0), rises to **65%** (round 1), **75%** (round 2), **85%** (rounds 3–4).
### Key Observations
- **Sujiko** maintains perfect accuracy (100%) regardless of feedback rounds, suggesting robustness or overfitting.
- The **Average line** shows consistent improvement, indicating overall positive impact of feedback rounds.
- **K-Clique** exhibits a sharp initial gain followed by a decline, possibly due to overfitting or diminishing returns.
- **Number Link** starts at 0% but shows marginal improvement, hinting at slow convergence.
- **Shinro** and **Keisuke** demonstrate steady gains, with Shinro achieving the second-highest final accuracy (85%).
### Interpretation
The data suggests that **Sujiko** is the most reliable method, maintaining perfect accuracy. The **Average line** highlights a general trend of improvement with more feedback, though individual methods vary significantly. **K-Clique**'s post-round-1 decline raises questions about its stability or suitability for iterative refinement. **Number Link**'s slow progress implies it may require more feedback or is less effective for this task. The divergence between methods underscores the importance of method selection based on task requirements and feedback dynamics.