## Bar Chart: Model Performance Drop (% of AUROC) Across Datasets
### Overview
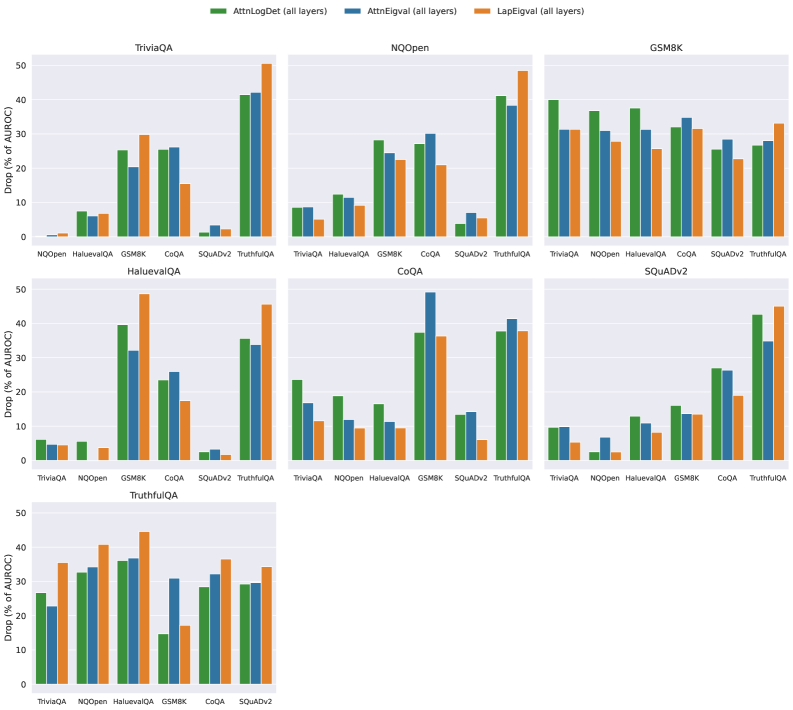
The image displays a grouped bar chart comparing the performance drop (as a percentage of AUROC) for three models—**AttnLog**, **AttnEig**, and **LapEig**—across seven question-answering datasets: **TriviaQA**, **NQOpen**, **GSM8K**, **HaluevalQA**, **CoQA**, **SQuADv2**, and **TruthfulQA**. Each dataset is represented by a cluster of three bars (one per model), with colors mapped to models via a legend at the top.
### Components/Axes
- **X-axis**: Datasets (TriviaQA, NQOpen, GSM8K, HaluevalQA, CoQA, SQuADv2, TruthfulQA), ordered left to right.
- **Y-axis**: Drop (% of AUROC), ranging from 0% to 50% in increments of 10%.
- **Legend**:
- Green: AttnLog (all layers)
- Blue: AttnEig (all layers)
- Orange: LapEig (all layers)
- **Bar Groups**: Each dataset has three adjacent bars (green, blue, orange) representing the three models.
### Detailed Analysis
1. **TriviaQA**:
- AttnLog: ~25% drop
- AttnEig: ~20% drop
- LapEig: ~30% drop
2. **NQOpen**:
- AttnLog: ~10% drop
- AttnEig: ~15% drop
- LapEig: ~25% drop
3. **GSM8K**:
- AttnLog: ~35% drop
- AttnEig: ~30% drop
- LapEig: ~35% drop
4. **HaluevalQA**:
- AttnLog: ~40% drop
- AttnEig: ~35% drop
- LapEig: ~45% drop
5. **CoQA**:
- AttnLog: ~5% drop
- AttnEig: ~10% drop
- LapEig: ~15% drop
6. **SQuADv2**:
- AttnLog: ~20% drop
- AttnEig: ~25% drop
- LapEig: ~30% drop
7. **TruthfulQA**:
- AttnLog: ~30% drop
- AttnEig: ~35% drop
- LapEig: ~40% drop
### Key Observations
- **LapEig** consistently shows the highest drop across most datasets (e.g., 45% in HaluevalQA, 40% in TruthfulQA), suggesting it is the least robust model.
- **AttnLog** performs best (lowest drop) in **CoQA** (~5%) and **NQOpen** (~10%), while **AttnEig** excels in **CoQA** (~10%).
- **GSM8K** and **HaluevalQA** exhibit the largest drops overall, with LapEig reaching ~45% in HaluevalQA.
- **SQuADv2** and **TruthfulQA** show moderate drops, with LapEig again leading in decline.
### Interpretation
The data indicates that **LapEig** is the least robust model, with the highest performance drops across nearly all datasets. **AttnLog** and **AttnEig** demonstrate more variability, with AttnLog outperforming others in specific datasets like CoQA and NQOpen. The largest drops in GSM8K and HaluevalQA suggest these datasets are more challenging for all models, potentially due to their complexity or ambiguity. The consistent underperformance of LapEig highlights its sensitivity to dataset-specific features, while AttnLog’s lower drops in CoQA and NQOpen may reflect better adaptability to structured or fact-based questions. These trends underscore the importance of model architecture design for robustness in QA tasks.