## Line Chart: Accuracy vs. Thinking Compute for Reasoning Methods
### Overview
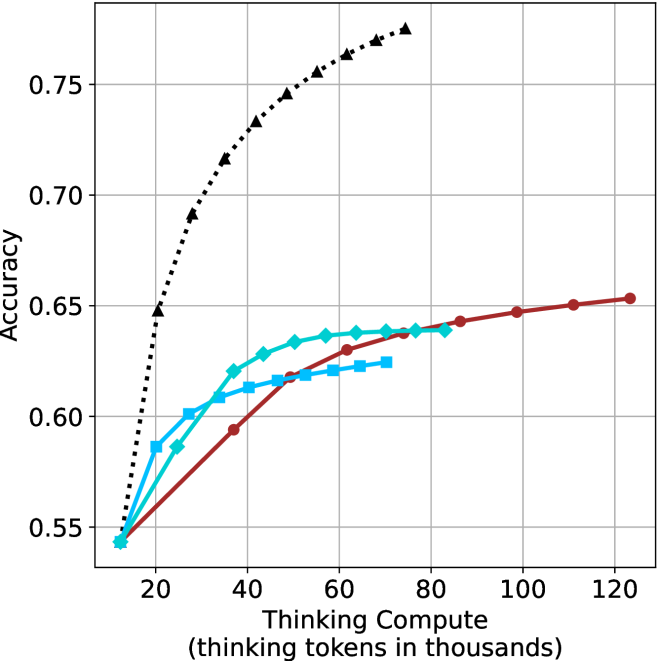
The image is a line chart comparing the performance (accuracy) of four different AI reasoning methods as a function of computational effort ("Thinking Compute"). The chart demonstrates how each method's accuracy scales with increased "thinking tokens," measured in thousands. All methods start at a similar baseline accuracy but diverge significantly as compute increases.
### Components/Axes
* **Chart Type:** Multi-series line chart with markers.
* **X-Axis:**
* **Title:** "Thinking Compute (thinking tokens in thousands)"
* **Scale:** Linear, ranging from approximately 10 to 125 (thousand tokens).
* **Major Ticks:** 20, 40, 60, 80, 100, 120.
* **Y-Axis:**
* **Title:** "Accuracy"
* **Scale:** Linear, ranging from 0.55 to approximately 0.78.
* **Major Ticks:** 0.55, 0.60, 0.65, 0.70, 0.75.
* **Legend:** Positioned in the **top-left corner** of the plot area. It contains four entries:
1. **Chain-of-Thought (CoT):** Black dotted line with upward-pointing triangle markers (▲).
2. **Self-Consistency (SC):** Cyan solid line with diamond markers (◆).
3. **Tree of Thoughts (ToT):** Blue solid line with square markers (■).
4. **Reflexion:** Red solid line with circle markers (●).
### Detailed Analysis
**Data Series Trends and Approximate Points:**
1. **Chain-of-Thought (CoT) - Black Dotted Line with Triangles:**
* **Trend:** Shows the steepest and most sustained upward slope. It demonstrates strong, near-logarithmic scaling with compute.
* **Data Points (Approximate):**
* ~10k tokens: 0.54 accuracy
* ~20k tokens: 0.65 accuracy
* ~40k tokens: 0.72 accuracy
* ~60k tokens: 0.76 accuracy
* ~80k tokens: 0.78 accuracy (highest point on the chart)
2. **Self-Consistency (SC) - Cyan Solid Line with Diamonds:**
* **Trend:** Rises quickly initially but begins to plateau after ~40k tokens. The curve flattens noticeably.
* **Data Points (Approximate):**
* ~10k tokens: 0.54 accuracy
* ~20k tokens: 0.58 accuracy
* ~40k tokens: 0.63 accuracy
* ~60k tokens: 0.64 accuracy
* ~80k tokens: 0.64 accuracy
3. **Tree of Thoughts (ToT) - Blue Solid Line with Squares:**
* **Trend:** Follows a path very similar to SC but consistently at a slightly lower accuracy level. It also plateaus in the same region.
* **Data Points (Approximate):**
* ~10k tokens: 0.54 accuracy
* ~20k tokens: 0.58 accuracy
* ~40k tokens: 0.61 accuracy
* ~60k tokens: 0.62 accuracy
* ~70k tokens: 0.625 accuracy (last visible point)
4. **Reflexion - Red Solid Line with Circles:**
* **Trend:** Shows a steady, approximately linear increase in accuracy across the entire compute range shown. It does not plateau within the chart's bounds but has a shallower slope than CoT.
* **Data Points (Approximate):**
* ~10k tokens: 0.54 accuracy
* ~40k tokens: 0.59 accuracy
* ~60k tokens: 0.63 accuracy
* ~80k tokens: 0.64 accuracy
* ~100k tokens: 0.65 accuracy
* ~120k tokens: 0.655 accuracy
### Key Observations
1. **Common Starting Point:** All four methods begin at nearly the same accuracy (~0.54) at the lowest compute level (~10k tokens).
2. **Divergent Scaling:** The primary insight is the dramatic divergence in performance scaling. CoT scales exceptionally well, while SC and ToT show diminishing returns. Reflexion scales steadily but more slowly.
3. **Plateau Behavior:** SC and ToT appear to hit an accuracy ceiling between 0.62-0.64 within the 40k-80k token range.
4. **Performance Hierarchy:** At any compute level above ~15k tokens, the clear performance order is: CoT > SC ≈ Reflexion (at mid-range) > ToT. At high compute (>80k), the order is CoT > Reflexion > SC/ToT (plateaued).
5. **Visual Grouping:** The SC (cyan) and ToT (blue) lines are tightly clustered, suggesting similar underlying efficiency characteristics, distinct from the other two methods.
### Interpretation
This chart provides a compelling visual argument about the **compute-efficiency trade-offs** of different AI reasoning strategies.
* **Chain-of-Thought (CoT)** is demonstrated to be the most **compute-efficient** method for achieving high accuracy. Its steep, sustained curve suggests that investing more "thinking tokens" directly and effectively translates into better performance, making it suitable for tasks where high accuracy is critical and compute is available.
* **Self-Consistency (SC) and Tree of Thoughts (ToT)** show **early saturation**. Their plateau indicates that beyond a certain point (~40k tokens), throwing more compute at the problem using these methods yields minimal accuracy gains. They may be better suited for resource-constrained environments where a "good enough" answer is needed quickly.
* **Reflexion** occupies a middle ground. Its linear scaling suggests a predictable, steady return on investment for additional compute. It doesn't achieve the peak performance of CoT but avoids the early plateau of SC/ToT, potentially offering a balanced approach for long-running processes.
The data suggests that the **architecture of the reasoning process** (linear chain vs. sampled consistency vs. tree search vs. iterative reflection) fundamentally dictates how well a model can leverage additional computational resources. CoT's simple, sequential structure appears uniquely scalable in this context. The chart is likely from a research paper comparing these prompting or agentic techniques, arguing for the superiority of CoT in scaling laws or highlighting the limitations of more complex methods like SC and ToT.