## Diagram: Convolutional Neural Network Layer Structure
### Overview
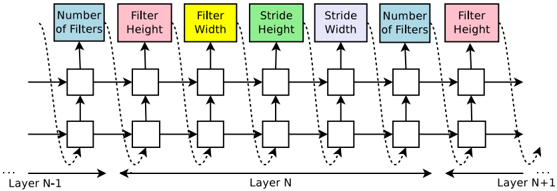
The image depicts a diagram of a convolutional neural network (CNN) layer structure, illustrating the flow of data and the application of filters and strides across multiple layers. The diagram shows the connections between neurons in adjacent layers, as well as the feedback loops that allow information to propagate through the network.
### Components/Axes
* **Layers:** The diagram shows three layers labeled "Layer N-1", "Layer N", and "Layer N+1".
* **Neurons:** Each layer consists of multiple neurons represented by squares.
* **Connections:** Neurons in adjacent layers are connected by arrows, indicating the flow of data.
* **Filters:** The diagram highlights the application of filters with parameters such as "Number of Filters" (light blue), "Filter Height" (light red), and "Filter Width" (yellow).
* **Strides:** The diagram also shows the application of strides with parameters such as "Stride Height" (light green) and "Stride Width" (light purple).
* **Feedback Loops:** Dotted arrows indicate feedback loops, allowing information to propagate through the network.
### Detailed Analysis
The diagram illustrates the structure of a convolutional neural network (CNN) layer. Each layer consists of multiple neurons, represented by squares. The neurons in adjacent layers are connected by arrows, indicating the flow of data.
The diagram highlights the application of filters with parameters such as "Number of Filters", "Filter Height", and "Filter Width". These filters are used to extract features from the input data. The diagram also shows the application of strides with parameters such as "Stride Height" and "Stride Width". Strides determine how far the filter moves across the input data.
Dotted arrows indicate feedback loops, allowing information to propagate through the network. These feedback loops can be used to improve the accuracy of the network.
The parameters are arranged in the following order:
1. Number of Filters (light blue)
2. Filter Height (light red)
3. Filter Width (yellow)
4. Stride Height (light green)
5. Stride Width (light purple)
This sequence repeats across the layers.
### Key Observations
* The diagram shows the basic structure of a convolutional neural network (CNN) layer.
* The diagram highlights the application of filters and strides.
* The diagram shows the presence of feedback loops.
* The diagram illustrates the flow of data through the network.
### Interpretation
The diagram provides a visual representation of the structure and operation of a convolutional neural network (CNN) layer. It demonstrates how filters and strides are applied to extract features from the input data, and how feedback loops can be used to improve the accuracy of the network. The diagram is useful for understanding the basic principles of CNNs and how they are used in various applications such as image recognition and natural language processing.