## Line Charts: Total Loss vs. Tokens for Different N Values
### Overview
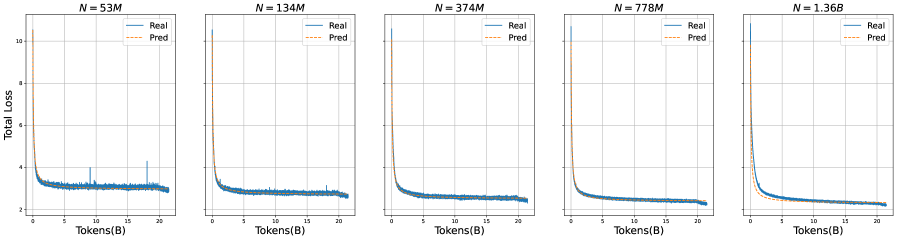
The image presents a series of five line charts, each displaying the "Total Loss" versus "Tokens(B)" for different values of 'N'. 'N' represents a parameter, possibly the number of parameters in a model, with values ranging from 53M to 1.36B. Each chart shows two lines: "Real" (solid blue) and "Pred" (dashed orange), representing the actual and predicted loss values, respectively. The charts aim to illustrate how the loss changes with the number of tokens processed for different model sizes.
### Components/Axes
* **Titles:** Each chart has a title indicating the value of 'N': N = 53M, N = 134M, N = 374M, N = 778M, and N = 1.36B.
* **Y-axis:** Labeled "Total Loss". The scale ranges from approximately 2 to 10.
* **X-axis:** Labeled "Tokens(B)". The scale ranges from 0 to 20.
* **Legend:** Located in the top-right corner of each chart.
* "Real": Solid blue line.
* "Pred": Dashed orange line.
* **Grid:** Each chart has a grid for easier value reading.
### Detailed Analysis
**Chart 1: N = 53M**
* **Real (Blue):** Starts around 6, rapidly decreases to approximately 3 by Tokens(B) = 2, then fluctuates slightly around 3. There are a few spikes at Tokens(B) values around 10 and 17.
* **Pred (Orange):** Closely follows the "Real" line, initially overlapping, then slightly diverging after Tokens(B) = 2.
* At Tokens(B) = 0, Real and Pred are approximately 10.
* At Tokens(B) = 2, Real and Pred are approximately 3.
* At Tokens(B) = 20, Real and Pred are approximately 3.
**Chart 2: N = 134M**
* **Real (Blue):** Starts around 10, rapidly decreases to approximately 2.5 by Tokens(B) = 2, then fluctuates slightly around 2.5.
* **Pred (Orange):** Closely follows the "Real" line, initially overlapping, then slightly diverging after Tokens(B) = 2.
* At Tokens(B) = 0, Real and Pred are approximately 10.
* At Tokens(B) = 2, Real and Pred are approximately 2.5.
* At Tokens(B) = 20, Real and Pred are approximately 2.5.
**Chart 3: N = 374M**
* **Real (Blue):** Starts around 10, rapidly decreases to approximately 2.5 by Tokens(B) = 2, then fluctuates slightly around 2.5.
* **Pred (Orange):** Closely follows the "Real" line, initially overlapping, then slightly diverging after Tokens(B) = 2.
* At Tokens(B) = 0, Real and Pred are approximately 10.
* At Tokens(B) = 2, Real and Pred are approximately 2.5.
* At Tokens(B) = 20, Real and Pred are approximately 2.5.
**Chart 4: N = 778M**
* **Real (Blue):** Starts around 10, rapidly decreases to approximately 2 by Tokens(B) = 2, then fluctuates slightly around 2.
* **Pred (Orange):** Closely follows the "Real" line, initially overlapping, then slightly diverging after Tokens(B) = 2.
* At Tokens(B) = 0, Real and Pred are approximately 10.
* At Tokens(B) = 2, Real and Pred are approximately 2.
* At Tokens(B) = 20, Real and Pred are approximately 2.
**Chart 5: N = 1.36B**
* **Real (Blue):** Starts around 10, rapidly decreases to approximately 2 by Tokens(B) = 2, then fluctuates slightly around 2.
* **Pred (Orange):** Closely follows the "Real" line, initially overlapping, then slightly diverging after Tokens(B) = 2.
* At Tokens(B) = 0, Real and Pred are approximately 10.
* At Tokens(B) = 2, Real and Pred are approximately 2.
* At Tokens(B) = 20, Real and Pred are approximately 2.
### Key Observations
* **Rapid Loss Reduction:** In all charts, the total loss decreases sharply within the first 2 billion tokens.
* **Convergence:** The "Real" and "Pred" lines converge closely after the initial rapid decrease, indicating good model prediction accuracy.
* **Fluctuations:** The "Real" loss exhibits slight fluctuations after the initial drop, suggesting some variability in the training process.
* **Impact of N:** As 'N' increases, the final loss value (after 20 billion tokens) tends to decrease slightly, suggesting that larger models (higher 'N') achieve lower loss.
* **Outliers:** The N=53M chart has some spikes in the "Real" loss line, which are not present in the other charts.
### Interpretation
The charts demonstrate the training process of a model, showing how the total loss decreases as the model processes more tokens. The close alignment of the "Real" and "Pred" lines indicates that the model is learning effectively and making accurate predictions. The trend of decreasing final loss with increasing 'N' suggests that larger models (with more parameters) tend to perform better in terms of minimizing loss. The spikes in the N=53M chart could indicate instability or specific challenges encountered during the training of that particular model size. The overall trend suggests that increasing the model size (N) leads to better performance, but with diminishing returns after a certain point, as the difference in final loss between N=778M and N=1.36B is relatively small.