## Line Chart: Accuracy vs. Sample Size
### Overview
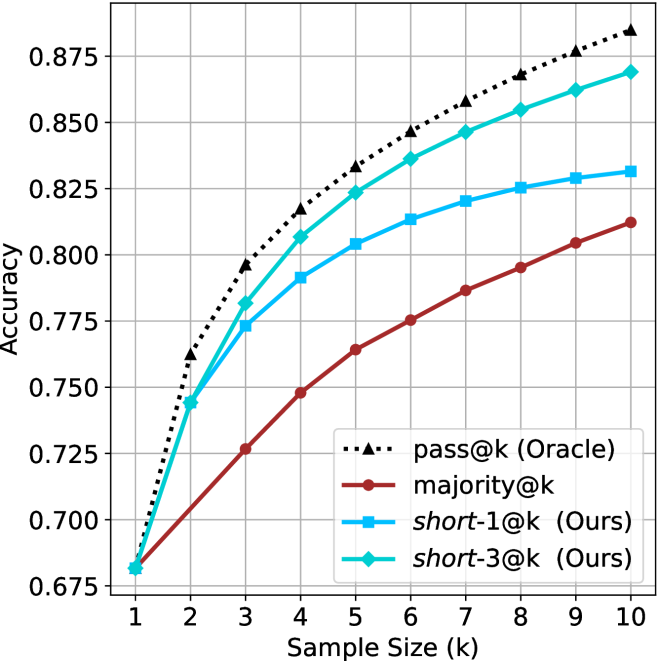
This image presents a line chart illustrating the relationship between accuracy and sample size (k) for four different methods: pass@k (Oracle), majority@k, short-1@k (Ours), and short-3@k (Ours). The chart displays how accuracy changes as the sample size increases from 1 to 10.
### Components/Axes
* **X-axis:** "Sample Size (k)" ranging from 1 to 10, with tick marks at each integer value.
* **Y-axis:** "Accuracy" ranging from 0.675 to 0.875, with tick marks at 0.025 intervals.
* **Legend:** Located in the bottom-right corner, identifying the four data series:
* pass@k (Oracle) - represented by a black dotted line.
* majority@k - represented by a maroon solid line.
* short-1@k (Ours) - represented by a blue solid line.
* short-3@k (Ours) - represented by a teal solid line.
* **Gridlines:** A light gray grid is present to aid in reading values.
### Detailed Analysis
Here's a breakdown of each line's trend and approximate data points:
* **pass@k (Oracle):** This line (black dotted) shows a consistently upward trend, starting at approximately 0.77 accuracy at k=1 and reaching approximately 0.86 accuracy at k=10.
* k=1: ~0.77
* k=2: ~0.79
* k=3: ~0.81
* k=4: ~0.825
* k=5: ~0.835
* k=6: ~0.84
* k=7: ~0.848
* k=8: ~0.855
* k=9: ~0.86
* k=10: ~0.865
* **majority@k:** This line (maroon) exhibits a slower, more gradual upward trend. It starts at approximately 0.68 accuracy at k=1 and reaches approximately 0.82 accuracy at k=10.
* k=1: ~0.68
* k=2: ~0.71
* k=3: ~0.735
* k=4: ~0.755
* k=5: ~0.77
* k=6: ~0.785
* k=7: ~0.80
* k=8: ~0.81
* k=9: ~0.815
* k=10: ~0.82
* **short-1@k (Ours):** This line (blue) shows a rapid increase in accuracy initially, then plateaus. It starts at approximately 0.78 accuracy at k=1 and reaches approximately 0.83 accuracy at k=10.
* k=1: ~0.78
* k=2: ~0.80
* k=3: ~0.81
* k=4: ~0.815
* k=5: ~0.82
* k=6: ~0.825
* k=7: ~0.827
* k=8: ~0.828
* k=9: ~0.83
* k=10: ~0.83
* **short-3@k (Ours):** This line (teal) also shows a rapid increase initially, then plateaus, but remains higher than short-1@k. It starts at approximately 0.81 accuracy at k=1 and reaches approximately 0.85 accuracy at k=10.
* k=1: ~0.81
* k=2: ~0.83
* k=3: ~0.84
* k=4: ~0.845
* k=5: ~0.85
* k=6: ~0.85
* k=7: ~0.85
* k=8: ~0.85
* k=9: ~0.85
* k=10: ~0.85
### Key Observations
* "pass@k (Oracle)" consistently outperforms all other methods across all sample sizes.
* "short-3@k (Ours)" performs better than "short-1@k (Ours)" across all sample sizes.
* The accuracy gains from increasing the sample size diminish for "short-1@k (Ours)" and "short-3@k (Ours)" after k=5.
* "majority@k" has the lowest accuracy across all sample sizes.
### Interpretation
The chart demonstrates the performance of different methods for a task (likely a classification or prediction task) as a function of the sample size used. The "Oracle" method, which presumably has access to perfect information, sets the upper bound on achievable accuracy. The "Ours" methods ("short-1@k" and "short-3@k") represent the performance of a new approach, and their accuracy is significantly lower than the "Oracle" but better than the "majority@k" baseline. The diminishing returns in accuracy for the "Ours" methods suggest that increasing the sample size beyond a certain point (around k=5) does not significantly improve performance. This could be due to the limitations of the method itself or the nature of the data. The relatively poor performance of "majority@k" indicates that a simple majority voting approach is not effective for this task. The chart suggests that the proposed "short-3@k" method is a promising approach, offering a good balance between accuracy and computational cost.