## Line Chart: Accuracy vs. Sample Size (k)
### Overview
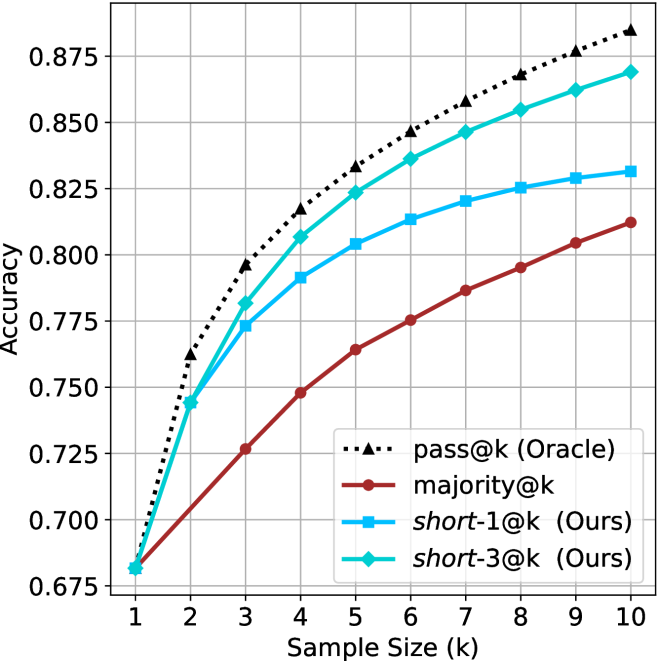
The chart compares the accuracy of four methods across increasing sample sizes (k=1 to k=10). Four data series are plotted: "pass@k (Oracle)" (dashed black), "majority@k" (solid red), "short-1@k (Ours)" (solid blue), and "short-3@k (Ours)" (solid green). All methods show upward trends, with "pass@k" consistently outperforming others.
### Components/Axes
- **X-axis**: "Sample Size (k)" (integer values 1–10)
- **Y-axis**: "Accuracy" (decimal values 0.675–0.875)
- **Legend**: Located in the bottom-right corner, with four entries:
- `pass@k (Oracle)`: Dashed black line
- `majority@k`: Solid red line
- `short-1@k (Ours)`: Solid blue line
- `short-3@k (Ours)`: Solid green line
### Detailed Analysis
1. **pass@k (Oracle)**:
- Starts at (1, 0.675) and increases steadily to (10, 0.875).
- Slope: Linear, with ~0.01 accuracy gain per unit k.
- Example points: (3, 0.75), (5, 0.8), (7, 0.85).
2. **majority@k**:
- Starts at (1, 0.675) and rises to (10, 0.81).
- Slope: Gradual, ~0.0035 accuracy gain per unit k.
- Example points: (5, 0.73), (7, 0.77), (9, 0.8).
3. **short-1@k (Ours)**:
- Begins at (1, 0.725) and reaches (10, 0.83).
- Slope: Moderate, ~0.0055 accuracy gain per unit k.
- Example points: (3, 0.75), (5, 0.79), (7, 0.82).
4. **short-3@k (Ours)**:
- Starts at (1, 0.725) and peaks at (10, 0.86).
- Slope: Steepest among non-Oracle methods, ~0.0085 accuracy gain per unit k.
- Example points: (3, 0.77), (5, 0.82), (7, 0.85).
### Key Observations
- **Oracle dominance**: "pass@k" maintains a consistent lead, with a 0.065 accuracy gap over "short-3@k" at k=10.
- **Shortlist performance**: "short-3@k" outperforms "short-1@k" by ~0.03 accuracy at k=10, suggesting longer shortlists improve results.
- **Majority@k lag**: The red line remains the lowest, with only a 0.135 accuracy gain from k=1 to k=10.
- **Convergence**: All methods narrow their performance gap with Oracle as k increases, but none surpass it.
### Interpretation
The chart demonstrates that larger sample sizes improve accuracy across all methods, with the Oracle ("pass@k") serving as an upper bound. The "short-3@k" method (green) shows the strongest performance among non-Oracle approaches, achieving 86% accuracy at k=10—13% higher than "majority@k". This suggests that increasing the shortlist size (from 1@k to 3@k) significantly enhances effectiveness, though still falls short of the Oracle. The linear trends imply predictable scaling, with no visible saturation points within the tested range (k=1–10). The Oracle's consistent lead highlights its theoretical optimality, while the "short-3@k" method may represent a practical compromise between computational cost and performance.