TECHNICAL ASSET FINGERPRINT
bc69fdafcb34031416a7fdf6
Click to view fullscreen
Press ESC or click to close
FOUND IN PAPERS
EXPERT: nemotron-free VERSION 1
RUNTIME: free/nvidia/nemotron-nano-12b-v2-vl:free
INTEL_VERIFIED
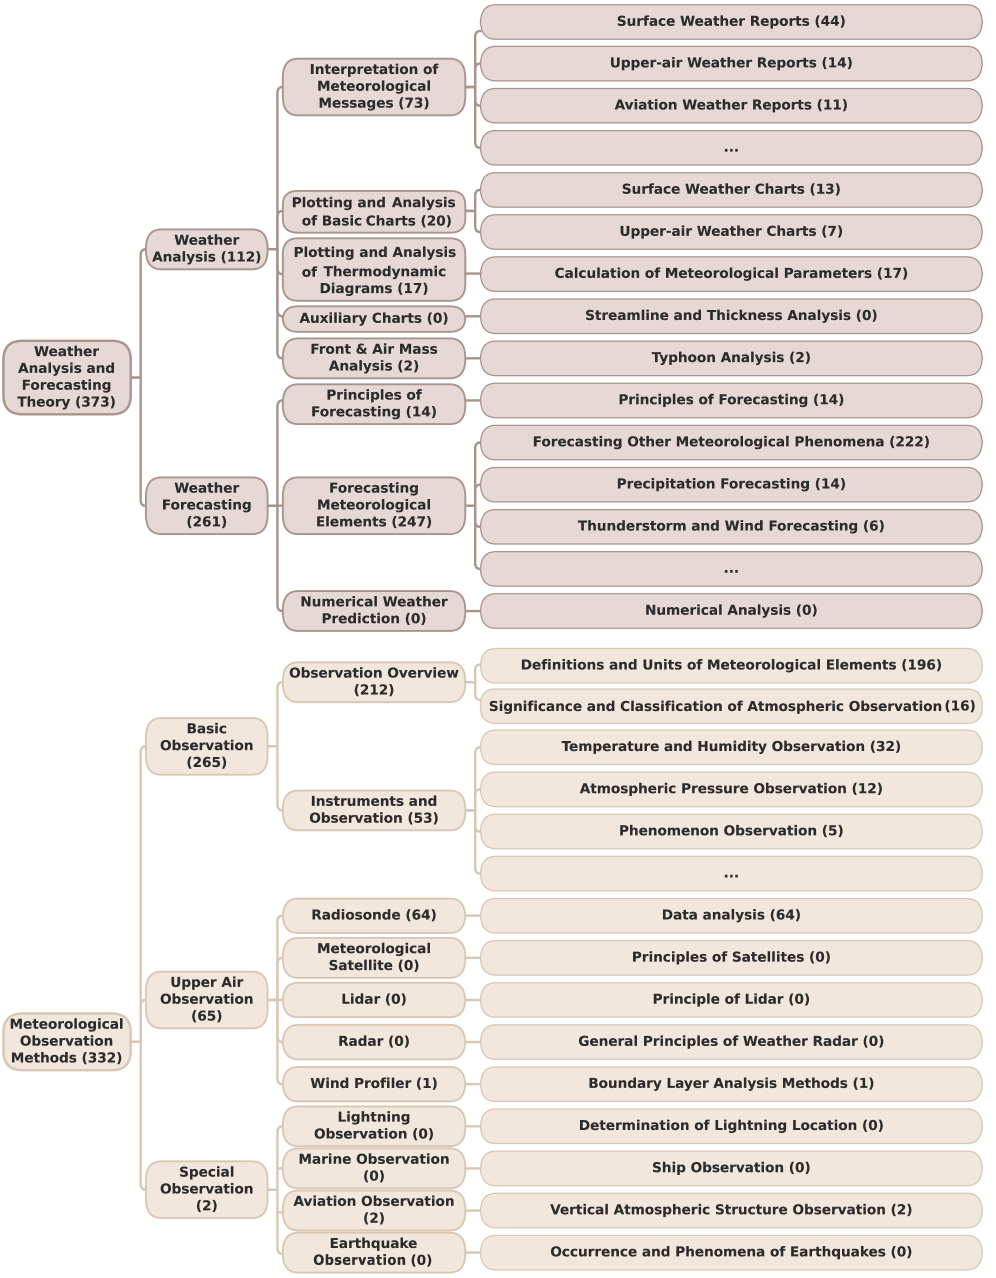
## Hierarchical Diagram: Meteorological Analysis and Forecasting Structure
### Overview
The image is a hierarchical diagram organized into two primary branches: **"Weather Analysis and Forecasting Theory"** (left) and **"Meteorological Observation Methods"** (right). Each branch contains subcategories with numerical values in parentheses, likely representing page numbers, references, or quantitative data points. The diagram uses indentation to denote hierarchical relationships, with arrows connecting parent and child nodes.
---
### Components/Axes
#### Left Branch: Weather Analysis and Forecasting Theory (373)
- **Subcategories**:
- **Interpretation of Meteorological Messages (73)**
- Surface Weather Reports (44)
- Upper-air Weather Reports (14)
- Aviation Weather Reports (11)
- ... (ellipsis indicates additional subcategories)
- **Plotting and Analysis of Basic Charts (20)**
- Surface Weather Charts (13)
- Upper-air Weather Charts (7)
- **Plotting and Analysis of Thermodynamic Diagrams (17)**
- Calculation of Meteorological Parameters (17)
- Streamline and Thickness Analysis (0)
- Typhoon Analysis (2)
- **Auxiliary Charts (0)**
- Front & Air Mass Analysis (2)
- **Principles of Forecasting (14)**
- **Forecasting Other Meteorological Phenomena (222)**
- Precipitation Forecasting (14)
- Thunderstorm and Wind Forecasting (6)
- ...
- **Numerical Weather Prediction (0)**
- Numerical Analysis (0)
#### Right Branch: Meteorological Observation Methods (332)
- **Subcategories**:
- **Basic Observation (265)**
- Observation Overview (212)
- Definitions and Units of Meteorological Elements (196)
- Significance and Classification of Atmospheric Observation (16)
- Instruments and Observation (53)
- Temperature and Humidity Observation (32)
- Atmospheric Pressure Observation (12)
- Phenomenon Observation (5)
- ...
- **Upper Air Observation (65)**
- Radiosonde (64)
- Data analysis (64)
- Satellite (0)
- Principles of Satellites (0)
- Lidar (0)
- Principle of Lidar (0)
- Radar (0)
- General Principles of Weather Radar (0)
- Wind Profiler (1)
- Boundary Layer Analysis Methods (1)
- Lightning Observation (0)
- Determination of Lightning Location (0)
- **Special Observation (2)**
- Marine Observation (0)
- Ship Observation (0)
- Aviation Observation (2)
- Vertical Atmospheric Structure Observation (2)
- Earthquake Observation (0)
- Occurrence and Phenomena of Earthquakes (0)
---
### Detailed Analysis
- **Numerical Values**:
- All subcategories include numerical values in parentheses (e.g., "Surface Weather Reports (44)"). These likely represent page numbers, reference counts, or data point quantities.
- Some subcategories have "0" (e.g., "Auxiliary Charts (0)"), indicating no associated data or references.
- The largest numerical value is **373** (Weather Analysis and Forecasting Theory), suggesting it is the most comprehensive or foundational section.
- **Hierarchical Structure**:
- The diagram uses indentation to show parent-child relationships. For example, "Plotting and Analysis of Thermodynamic Diagrams (17)" is a child of "Weather Analysis and Forecasting Theory (373)."
- Arrows connect nodes, emphasizing the flow of information from broader categories to specific subcategories.
- **Ellipses**:
- The use of "..." (ellipsis) indicates that some subcategories are omitted for brevity, implying the diagram is a condensed representation of a larger structure.
---
### Key Observations
1. **Dominance of Forecasting and Analysis**:
- The left branch ("Weather Analysis and Forecasting Theory") contains the highest numerical value (373), suggesting it is the most extensive or critical component of the diagram.
- Subcategories like "Forecasting Other Meteorological Phenomena (222)" and "Plotting and Analysis of Thermodynamic Diagrams (17)" highlight the focus on predictive and analytical methods.
2. **Observation Methods**:
- The right branch ("Meteorological Observation Methods") has a lower total value (332) compared to the left branch.
- Subcategories like "Radiosonde (64)" and "Aviation Observation (2)" indicate specific tools and techniques for data collection.
3. **Zero-Value Subcategories**:
- Several subcategories (e.g., "Auxiliary Charts (0)", "Satellite (0)") have "0" in parentheses, possibly indicating incomplete data, placeholder values, or areas requiring further development.
---
### Interpretation
- **Purpose of the Diagram**:
The diagram organizes meteorological knowledge into two core domains: **theoretical analysis/forecasting** and **observation methods**. This structure reflects the interdependence of data collection (observation) and data interpretation (analysis).
- **Numerical Significance**:
The numerical values likely represent the depth of coverage or reference counts for each subcategory. For example, "Surface Weather Reports (44)" may indicate 44 pages of content or 44 data points in a textbook.
- **Gaps and Anomalies**:
The presence of "0" values (e.g., "Numerical Weather Prediction (0)") suggests either incomplete data, placeholder entries, or areas where the diagram is intentionally left blank for future expansion.
- **Hierarchical Flow**:
The diagram emphasizes a top-down approach, starting with broad categories (e.g., "Weather Analysis and Forecasting Theory") and drilling down into specific techniques (e.g., "Thermodynamic Diagrams"). This mirrors the workflow of meteorologists, who first analyze data before applying forecasting principles.
- **Practical Implications**:
The diagram could serve as a roadmap for meteorological education, guiding learners through foundational concepts (e.g., "Definitions and Units of Meteorological Elements") to advanced topics (e.g., "Numerical Weather Prediction").
---
### Final Notes
- **Language**: The diagram is entirely in English.
- **Data Completeness**: While the diagram is comprehensive, the use of ellipses and zero values indicates it is a simplified or partial representation of a larger system.
- **Visual Trends**: No explicit trends (e.g., slopes, distributions) are present, as the diagram is structural rather than numerical.
DECODING INTELLIGENCE...